Show the code
library(readxl)

doanh_thu <- readxl::read_excel("doanh_thu_ban_hang.xlsx")

doanh_thu <- as.data.frame(doanh_thu)

doanh_thu <- doanh_thu[ , c(1, 2, 5, 8, 6, 3, 4, 7, 9)]

table(doanh_thu$`Giới tính`, useNA = "no") -> genderlibrary(readxl)
doanh_thu <- readxl::read_excel("doanh_thu_ban_hang.xlsx")
doanh_thu <- as.data.frame(doanh_thu)
doanh_thu <- doanh_thu[ , c(1, 2, 5, 8, 6, 3, 4, 7, 9)]
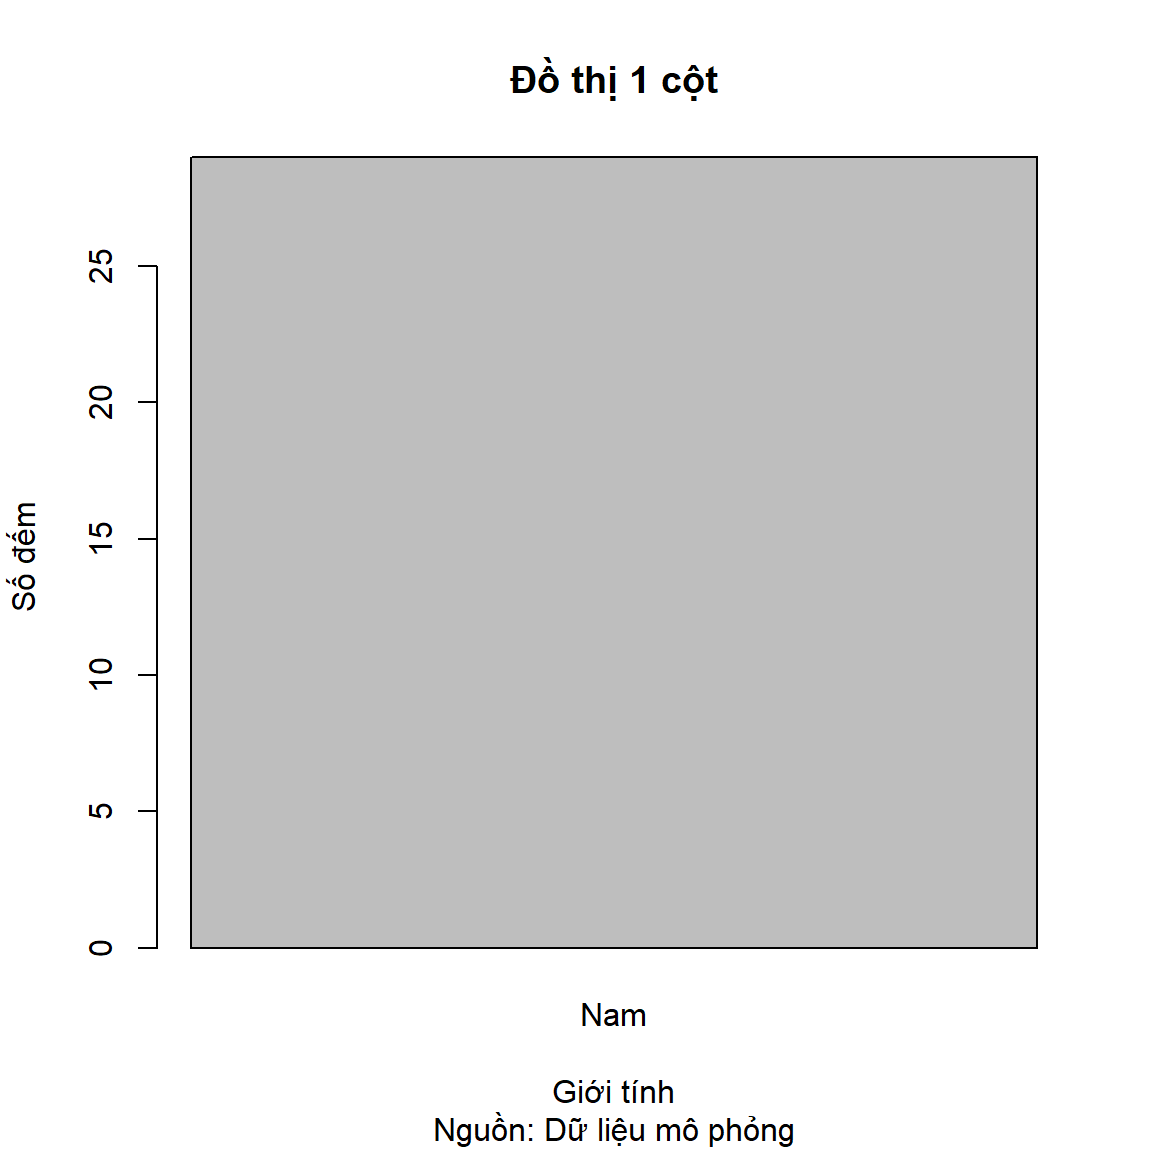
table(doanh_thu$`Giới tính`, useNA = "no") -> genderbarplot(height = gender[1],
xlab = "Giới tính",
ylab = "Số đếm",
main = "Đồ thị 1 cột",
sub = "Nguồn: Dữ liệu mô phỏng"
)
# library(precisePlacement)

par(pty = "s")
par(mar = c(6, 6, 6, 6))
par(oma = c(2, 2, 2, 2))
par(xpd = TRUE)

barplot(height = gender[1],
        las = 1,
        xlab = "Giới tính",
        ylab = "Số đếm",
        main = "Đồ thị 1 cột",
        sub = "Nguồn: Dữ liệu mô phỏng",
        xaxs = "i",
        yaxs = "i",
        col = c("coral"),
        ylim = c(0, 100),
        horiz = FALSE,
        border = c("yellow3")
)

par("usr") # tọa độ trục x và y
[1] 0.2 1.2 0.0 100.0box(which = "plot", col = "purple")
box(which = "outer", col = "darkgreen")
box(which = "figure", col = "cyan")
# showMarginLines()
# showOuterMarginLines()
# highlightDataRegion()
# highlightDeviceRegion()
# highlightFigureRegion()
# highlightPlotRegion()
abline(h = 50,
v = (par("usr")[1] + par("usr")[2])/2,
col = "red",
lty = 2)
text(x = (par("usr")[1] + par("usr")[2])/2,
y = 0,
labels = as.character((par("usr")[1] + par("usr")[2])/2),
pos = 1,
font = 2)
abline(v = par("usr")[1],
col = "red",
lty = 2)
text(x = par("usr")[1],
y = 0,
labels = as.character(par("usr")[1]),
pos = 1,
font = 2)
abline(v = par("usr")[2],
col = "red",
lty = 2)
text(x = par("usr")[2],
y = 0,
labels = as.character(par("usr")[2]),
pos = 1,
font = 2)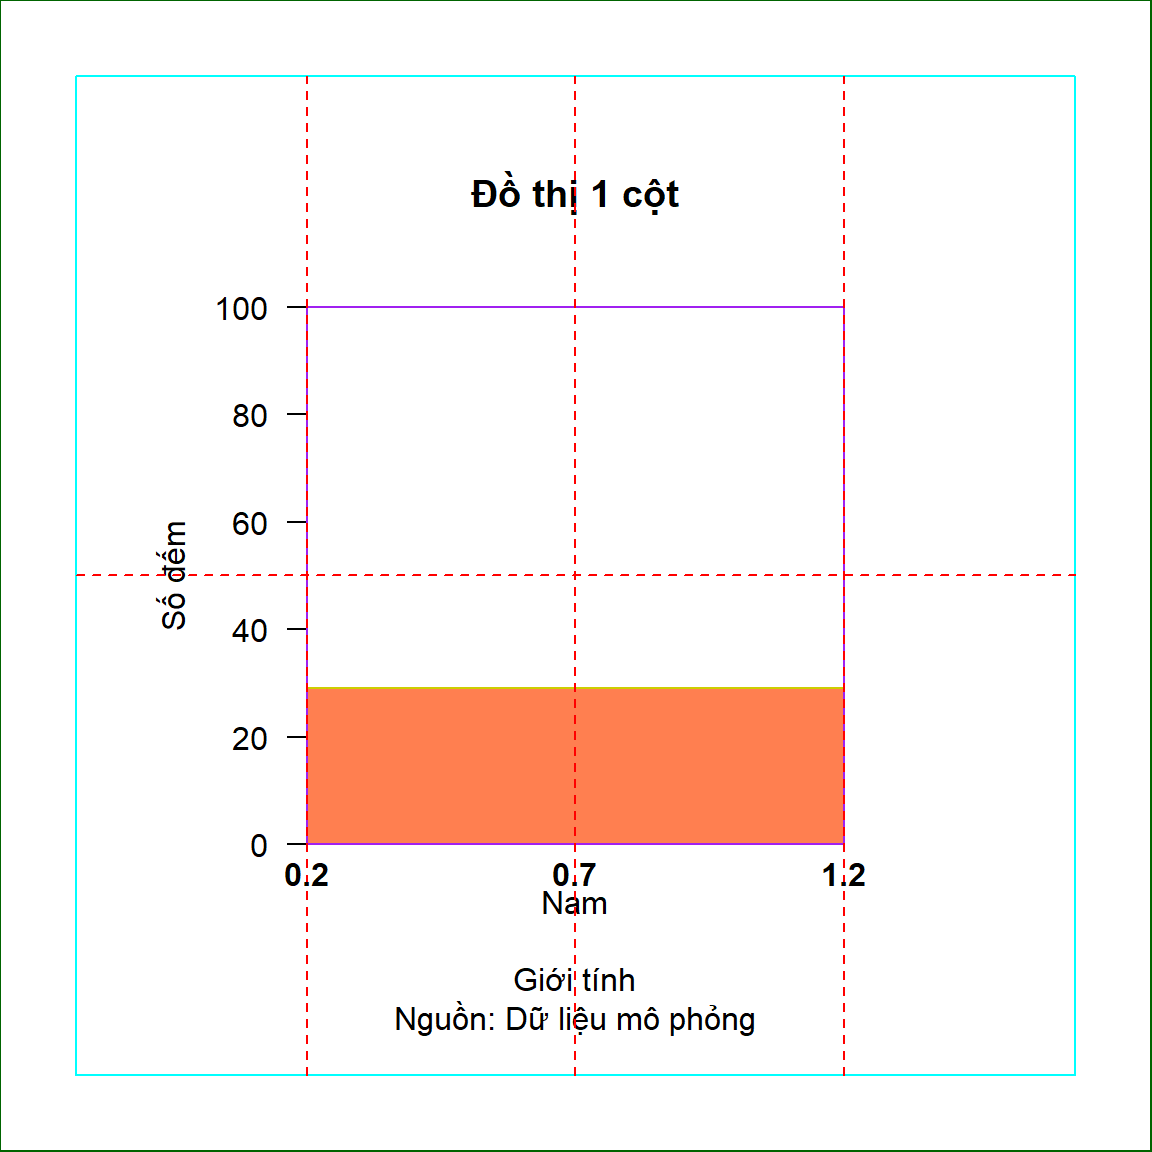
Đồ thị được vẽ y chang đồ thị ban đầu
par(pty = "s")
par(mar = c(6, 6, 6, 6))
par(oma = c(2, 2, 2, 2))
par(xpd = TRUE)

barplot(height = gender[1],
        las = 1,
        xlab = "Giới tính",
        ylab = "Số đếm",
        main = "Đồ thị 1 cột",
        sub = "Nguồn: Dữ liệu mô phỏng",
        xaxs = "i",
        yaxs = "i",
        col = c("coral"),
        xlim = c(0.2, 1.2), # setup chính xác vị trí xlim
        ylim = c(0, 100),
        horiz = FALSE,
        beside = TRUE,
        border = c("yellow3")
)

# par("usr") # tọa độ trục x và y

box(which = "plot", col = "purple")
box(which = "outer", col = "darkgreen")
box(which = "figure", col = "cyan")

abline(h = 50,
       v = (par("usr")[1] + par("usr")[2])/2,
       col = "red",
       lty = 2)

text(x = (par("usr")[1] + par("usr")[2])/2,
     y = 0,
     labels = as.character((par("usr")[1] + par("usr")[2])/2),
     pos = 1,
     font = 2)

abline(v = par("usr")[1],
       col = "red",
       lty = 2)

text(x = par("usr")[1],
     y = 0,
     labels = as.character(par("usr")[1]),
     pos = 1,
     font = 2)

abline(v = par("usr")[2],
       col = "red",
       lty = 2)

text(x = par("usr")[2],
     y = 0,
     labels = as.character(par("usr")[2]),
     pos = 1,
     font = 2)
Thay đổi giá trị xlim sẽ làm thay đổi độ lớn của cột
par(pty = "s")
par(mar = c(6, 6, 6, 6))
par(oma = c(2, 2, 2, 2))
par(xpd = TRUE)

barplot(height = gender[1],
        las = 1,
        xlab = "Giới tính",
        ylab = "Số đếm",
        main = "Đồ thị 1 cột",
        sub = "Nguồn: Dữ liệu mô phỏng",
        xaxs = "i",
        yaxs = "i",
        col = c("coral"),
        xlim = c(-1, 1),
        ylim = c(0, 100),
        horiz = FALSE,
        beside = TRUE,
        border = c("yellow3")
)

# par("usr") # tọa độ trục x và y

box(which = "plot", col = "purple")
box(which = "outer", col = "darkgreen")
box(which = "figure", col = "cyan")

abline(h = 50,
       v = (par("usr")[1] + par("usr")[2])/2,
       col = "red",
       lty = 2)

text(x = (par("usr")[1] + par("usr")[2])/2,
     y = 0,
     labels = as.character((par("usr")[1] + par("usr")[2])/2),
     pos = 1,
     font = 2)

abline(v = par("usr")[1],
       col = "red",
       lty = 2)

text(x = par("usr")[1],
     y = 0,
     labels = as.character(par("usr")[1]),
     pos = 1,
     font = 2)

abline(v = par("usr")[2],
       col = "red",
       lty = 2)

text(x = par("usr")[2],
     y = 0,
     labels = as.character(par("usr")[2]),
     pos = 1,
     font = 2)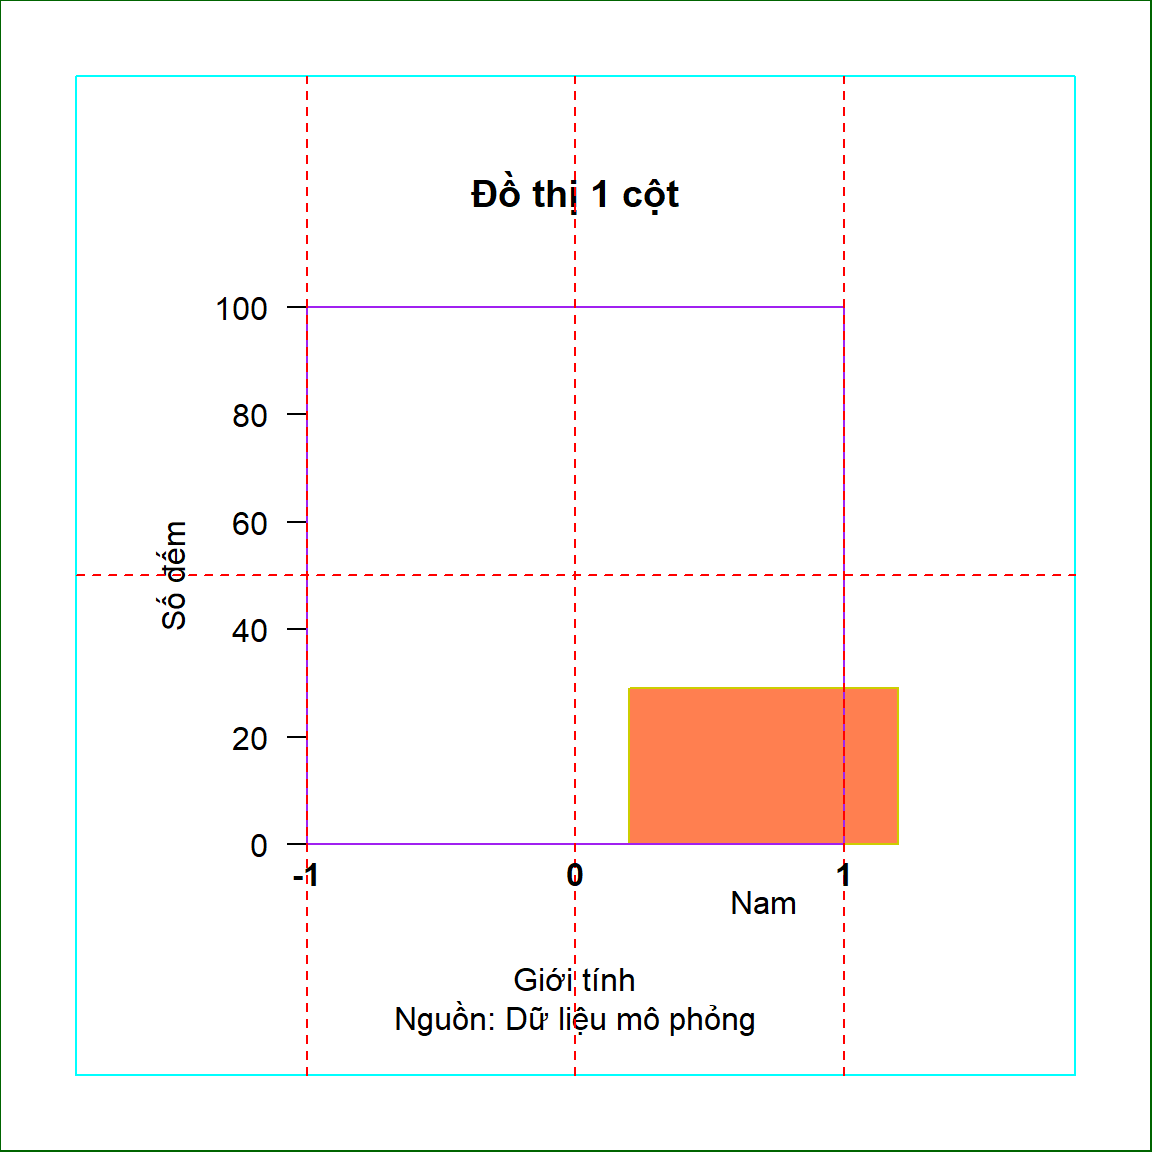
Thêm tham số space với giá trị là đẩy cột ra một khoảng về phía bên phải
par(pty = "s")
par(mar = c(6, 6, 6, 6))
par(oma = c(2, 2, 2, 2))
par(xpd = TRUE)

barplot(height = gender[1],
        las = 1,
        xlab = "Giới tính",
        ylab = "Số đếm",
        main = "Đồ thị 1 cột",
        sub = "Nguồn: Dữ liệu mô phỏng",
        xaxs = "i",
        yaxs = "i",
        col = c("coral"),
        xlim = c(-1, 1),
        space = c(0),
        ylim = c(0, 100),
        horiz = FALSE,
        beside = TRUE,
        border = c("yellow3")
)

# par("usr") # tọa độ trục x và y

box(which = "plot", col = "purple")
box(which = "outer", col = "darkgreen")
box(which = "figure", col = "cyan")

abline(h = 50,
       v = (par("usr")[1] + par("usr")[2])/2,
       col = "red",
       lty = 2)

text(x = (par("usr")[1] + par("usr")[2])/2,
     y = 0,
     labels = as.character((par("usr")[1] + par("usr")[2])/2),
     pos = 1,
     font = 2)

abline(v = par("usr")[1],
       col = "red",
       lty = 2)

text(x = par("usr")[1],
     y = 0,
     labels = as.character(par("usr")[1]),
     pos = 1,
     font = 2)

abline(v = par("usr")[2],
       col = "red",
       lty = 2)

text(x = par("usr")[2],
     y = 0,
     labels = as.character(par("usr")[2]),
     pos = 1,
     font = 2)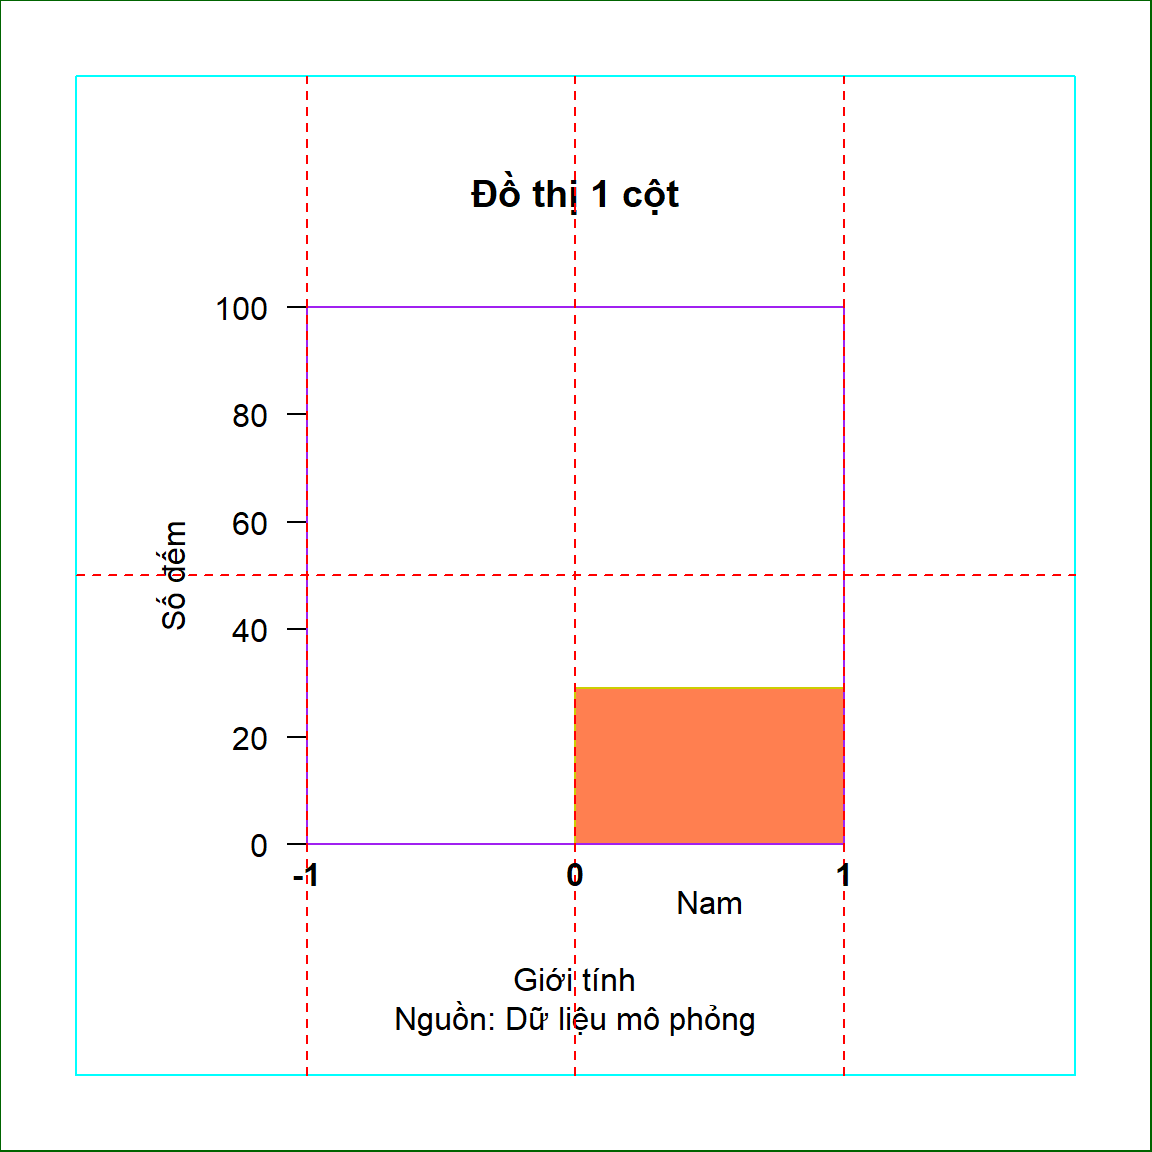
Chỉnh thêm chút
par(pty = "s")
par(mar = c(6, 6, 6, 6))
par(oma = c(2, 2, 2, 2))
par(xpd = TRUE)

barplot(height = gender[1],
        las = 1,
        xlab = "Giới tính",
        ylab = "Số đếm",
        main = "Đồ thị 1 cột",
        sub = "Nguồn: Dữ liệu mô phỏng",
        xaxs = "i",
        yaxs = "i",
        col = c("coral"),
        xlim = c(-1, 1),
        space = c(-0.5),
        ylim = c(0, 100),
        horiz = FALSE,
        beside = TRUE,
        border = c("yellow3")
)

# par("usr") # tọa độ trục x và y

box(which = "plot", col = "purple")
box(which = "outer", col = "darkgreen")
box(which = "figure", col = "cyan")

abline(h = 50,
       v = (par("usr")[1] + par("usr")[2])/2,
       col = "red",
       lty = 2)

text(x = (par("usr")[1] + par("usr")[2])/2,
     y = 0,
     labels = as.character((par("usr")[1] + par("usr")[2])/2),
     pos = 1,
     font = 2)

##

abline(v = par("usr")[1],
       col = "red",
       lty = 2)

text(x = par("usr")[1],
     y = 0,
     labels = as.character(par("usr")[1]),
     pos = 1,
     font = 2)

abline(v = par("usr")[1]/2,
       col = "red",
       lty = 2)

text(x = par("usr")[1]/2,
     y = 0,
     labels = as.character(par("usr")[1]/2),
     pos = 1,
     font = 2)

##

abline(v = par("usr")[2],
       col = "red",
       lty = 2)

text(x = par("usr")[2],
     y = 0,
     labels = as.character(par("usr")[2]),
     pos = 1,
     font = 2)

abline(v = par("usr")[2]/2,
       col = "red",
       lty = 2)

text(x = par("usr")[2]/2,
     y = 0,
     labels = as.character(par("usr")[2]/2),
     pos = 1,
     font = 2)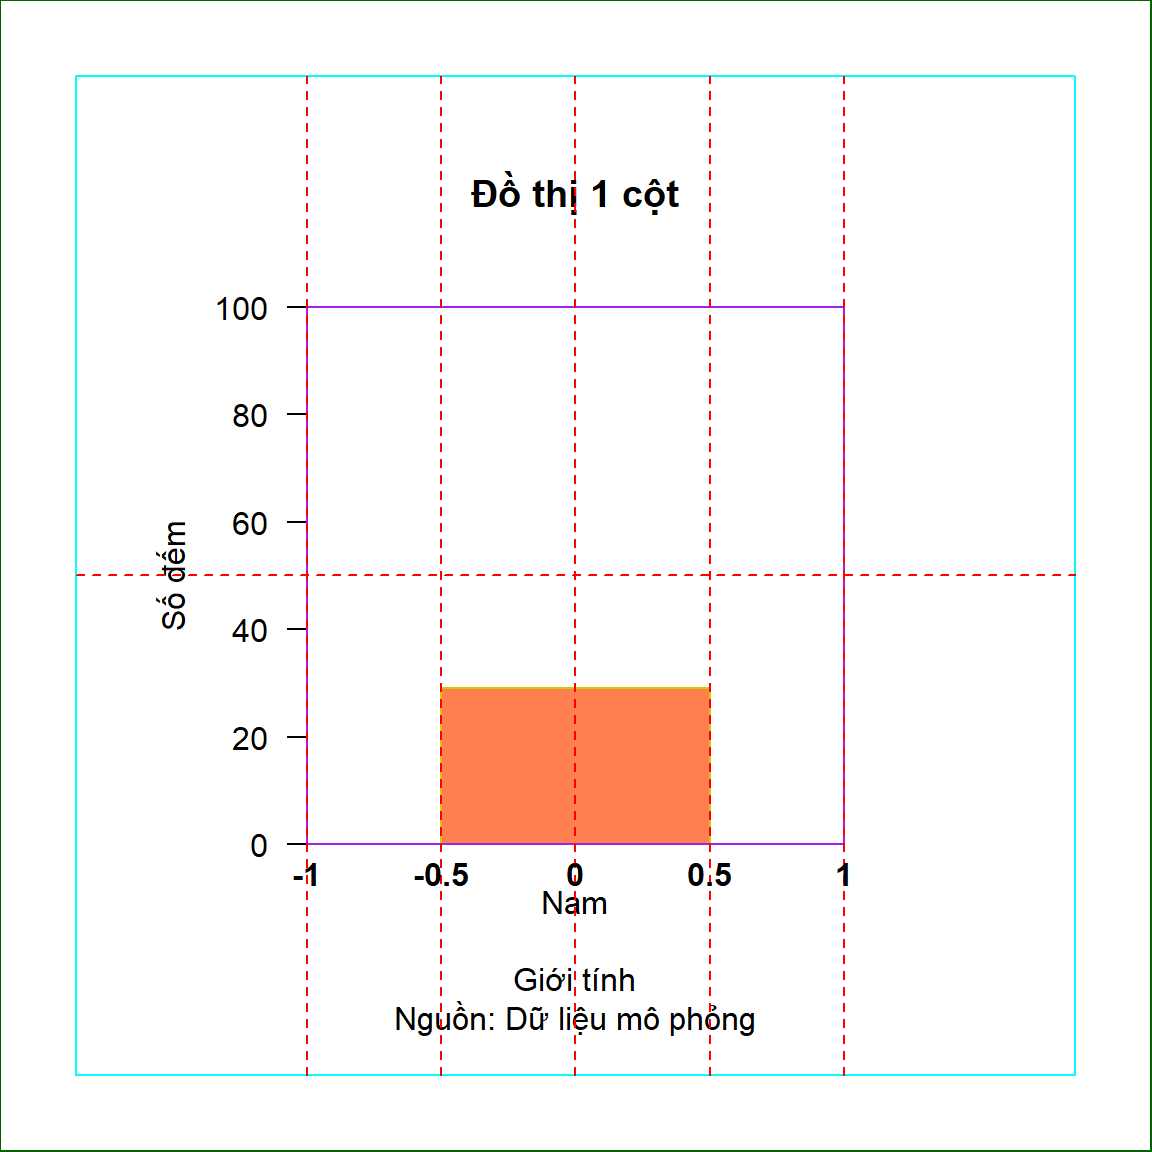
Chỉnh thêm chút nữa
par(pty = "s")
par(mar = c(6, 6, 6, 6))
par(oma = c(2, 2, 2, 2))
par(xpd = TRUE)

barplot(height = gender[1],
        las = 1,
        xlab = "Giới tính",
        ylab = "Số đếm",
        main = "Đồ thị 1 cột",
        sub = "Nguồn: Dữ liệu mô phỏng",
        xaxs = "i",
        yaxs = "i",
        col = c("coral"),
        xlim = c(-1, 1),
        # width = c(1), # mặc định là 1
        width = c(0.5),
        space = c(-0.5),
        ylim = c(0, 100),
        horiz = FALSE,
        beside = TRUE,
        border = c("yellow3")
)

# par("usr") # tọa độ trục x và y

box(which = "plot", col = "purple")
box(which = "outer", col = "darkgreen")
box(which = "figure", col = "cyan")

abline(h = 50,
       v = (par("usr")[1] + par("usr")[2])/2,
       col = "red",
       lty = 2)

text(x = (par("usr")[1] + par("usr")[2])/2,
     y = 0,
     labels = as.character((par("usr")[1] + par("usr")[2])/2),
     pos = 1,
     font = 2)

##

abline(v = par("usr")[1],
       col = "red",
       lty = 2)

text(x = par("usr")[1],
     y = 0,
     labels = as.character(par("usr")[1]),
     pos = 1,
     font = 2)

abline(v = par("usr")[1]/2,
       col = "red",
       lty = 2)

text(x = par("usr")[1]/2,
     y = 0,
     labels = as.character(par("usr")[1]/2),
     pos = 1,
     font = 2)

##

abline(v = par("usr")[2],
       col = "red",
       lty = 2)

text(x = par("usr")[2],
     y = 0,
     labels = as.character(par("usr")[2]),
     pos = 1,
     font = 2)

abline(v = par("usr")[2]/2,
       col = "red",
       lty = 2)

text(x = par("usr")[2]/2,
     y = 0,
     labels = as.character(par("usr")[2]/2),
     pos = 1,
     font = 2)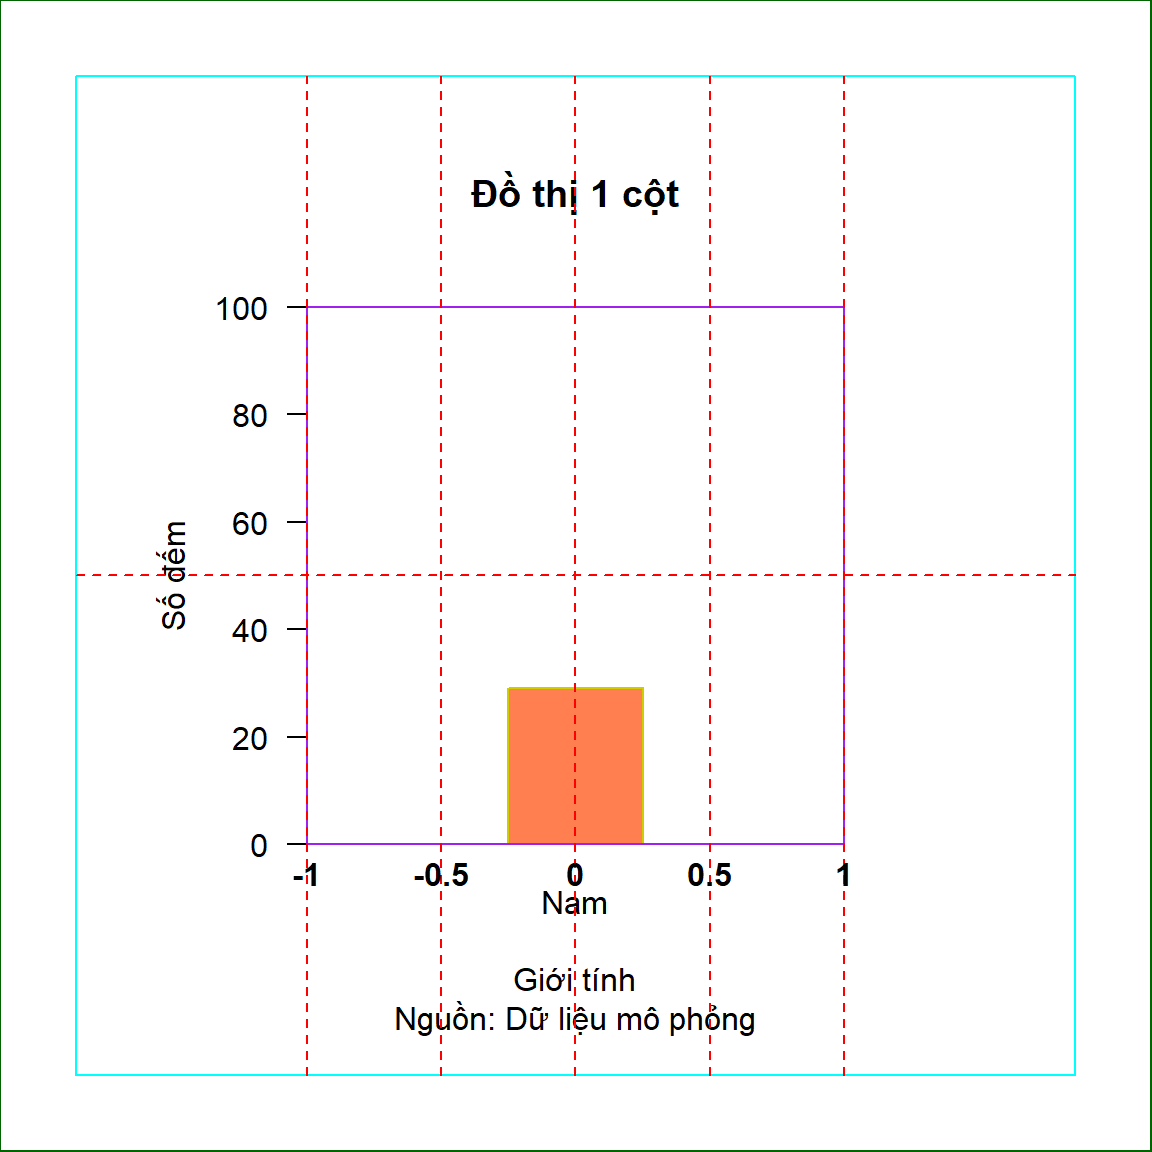
Nếu muốn đẩy cột qua khoảng x ~ (0, 0.5) thì ta thay đổi thông số space
par(pty = "s")
par(mar = c(6, 6, 6, 6))
par(oma = c(2, 2, 2, 2))
par(xpd = TRUE)

barplot(height = gender[1],
        las = 1,
        xlab = "Giới tính",
        ylab = "Số đếm",
        main = "Đồ thị 1 cột",
        sub = "Nguồn: Dữ liệu mô phỏng",
        xaxs = "i",
        yaxs = "i",
        col = c("coral"),
        xlim = c(-1, 1),
        # width = c(1), # mặc định là 1
        width = c(0.5),
        space = c(0),
        ylim = c(0, 100),
        horiz = FALSE,
        beside = TRUE,
        border = c("yellow3")
)

# par("usr") # tọa độ trục x và y

box(which = "plot", col = "purple")
box(which = "outer", col = "darkgreen")
box(which = "figure", col = "cyan")

abline(h = 50,
       v = (par("usr")[1] + par("usr")[2])/2,
       col = "red",
       lty = 2)

text(x = (par("usr")[1] + par("usr")[2])/2,
     y = 0,
     labels = as.character((par("usr")[1] + par("usr")[2])/2),
     pos = 1,
     font = 2)

##

abline(v = par("usr")[1],
       col = "red",
       lty = 2)

text(x = par("usr")[1],
     y = 0,
     labels = as.character(par("usr")[1]),
     pos = 1,
     font = 2)

abline(v = par("usr")[1]/2,
       col = "red",
       lty = 2)

text(x = par("usr")[1]/2,
     y = 0,
     labels = as.character(par("usr")[1]/2),
     pos = 1,
     font = 2)

##

abline(v = par("usr")[2],
       col = "red",
       lty = 2)

text(x = par("usr")[2],
     y = 0,
     labels = as.character(par("usr")[2]),
     pos = 1,
     font = 2)

abline(v = par("usr")[2]/2,
       col = "red",
       lty = 2)

text(x = par("usr")[2]/2,
     y = 0,
     labels = as.character(par("usr")[2]/2),
     pos = 1,
     font = 2)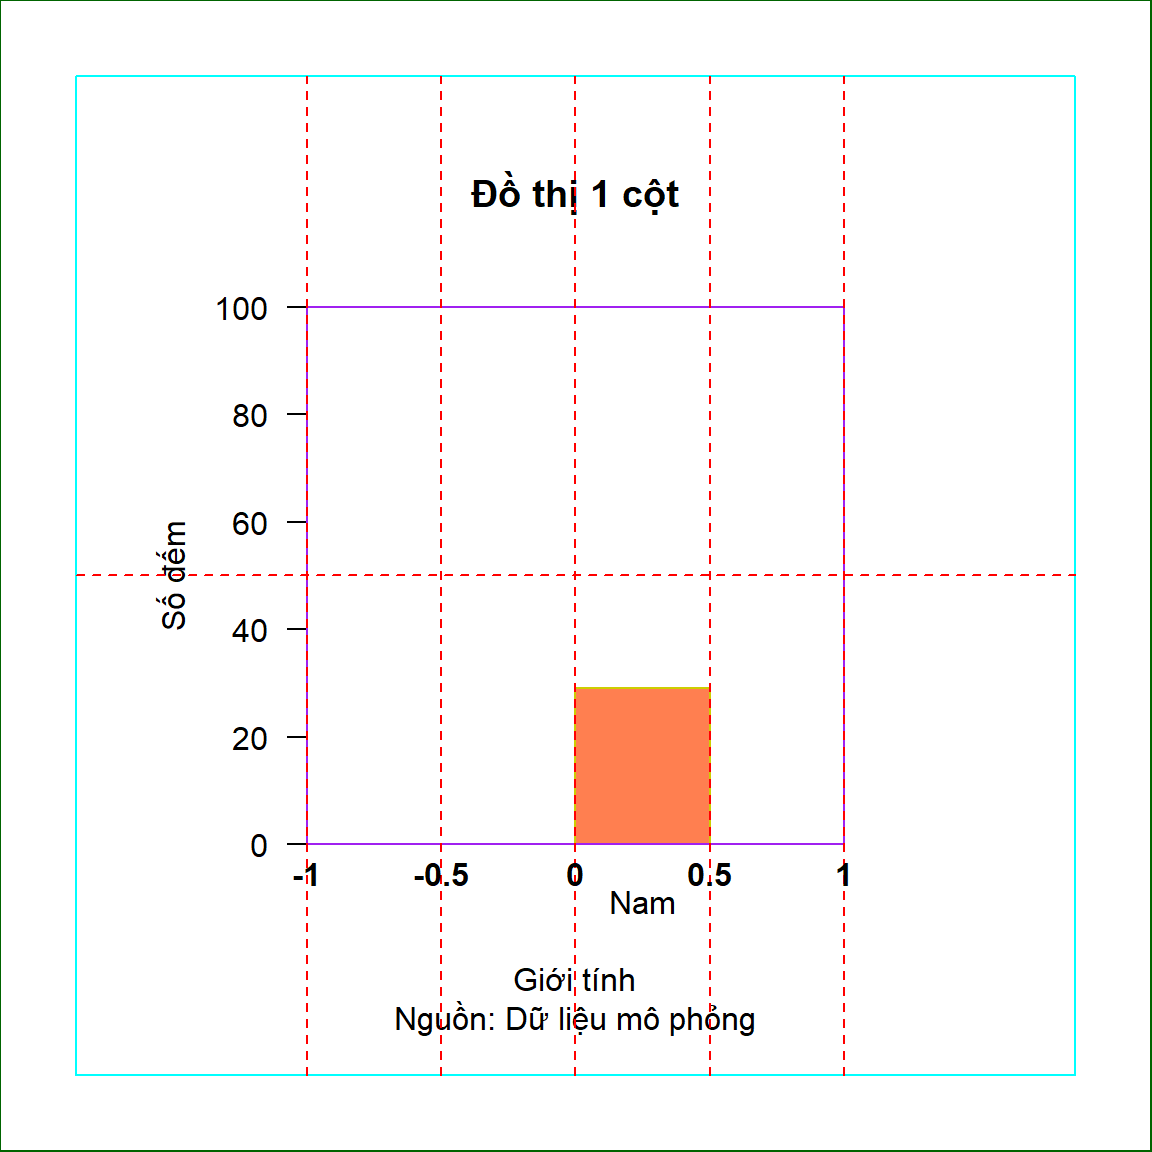
Tiếp tục giảm độ rộng của cột và canh giữa đồ thị
par(pty = "s")
par(mar = c(6, 6, 6, 6))
par(oma = c(2, 2, 2, 2))
par(xpd = TRUE)

barplot(height = gender[1],
        las = 1,
        xlab = "Giới tính",
        ylab = "Số đếm",
        main = "Đồ thị 1 cột",
        sub = "Nguồn: Dữ liệu mô phỏng",
        xaxs = "i",
        yaxs = "i",
        col = c("coral"),
        xlim = c(-1, 1),
        # width = c(1), # mặc định là 1
        width = c(0.25),
        space = c(-0.5), # tương ứng là tọa độ ở -0.125
        ylim = c(0, 100),
        horiz = FALSE,
        beside = TRUE,
        border = c("yellow3")
)

# par("usr") # tọa độ trục x và y

box(which = "plot", col = "purple")
box(which = "outer", col = "darkgreen")
box(which = "figure", col = "cyan")

abline(h = 50,
       v = (par("usr")[1] + par("usr")[2])/2,
       col = "red",
       lty = 2)

text(x = (par("usr")[1] + par("usr")[2])/2,
     y = 0,
     labels = as.character((par("usr")[1] + par("usr")[2])/2),
     pos = 1,
     font = 2)

##

abline(v = par("usr")[1],
       col = "red",
       lty = 2)

text(x = par("usr")[1],
     y = 0,
     labels = as.character(par("usr")[1]),
     pos = 1,
     font = 2)

abline(v = par("usr")[1]/2,
       col = "red",
       lty = 2)

text(x = par("usr")[1]/2,
     y = 0,
     labels = as.character(par("usr")[1]/2),
     pos = 1,
     font = 2)

##

abline(v = par("usr")[2],
       col = "red",
       lty = 2)

text(x = par("usr")[2],
     y = 0,
     labels = as.character(par("usr")[2]),
     pos = 1,
     font = 2)

abline(v = par("usr")[2]/2,
       col = "red",
       lty = 2)

text(x = par("usr")[2]/2,
     y = 0,
     labels = as.character(par("usr")[2]/2),
     pos = 1,
     font = 2)

##

abline(v = par("usr")[2]/4,
       col = "red",
       lty = 2)

text(x = par("usr")[2]/4,
     y = 0,
     labels = as.character(par("usr")[2]/4),
     pos = 1,
     font = 2)

##

abline(v = par("usr")[1]/4,
       col = "red",
       lty = 2)

text(x = par("usr")[1]/4,
     y = 0,
     labels = as.character(par("usr")[1]/4),
     pos = 1,
     font = 2)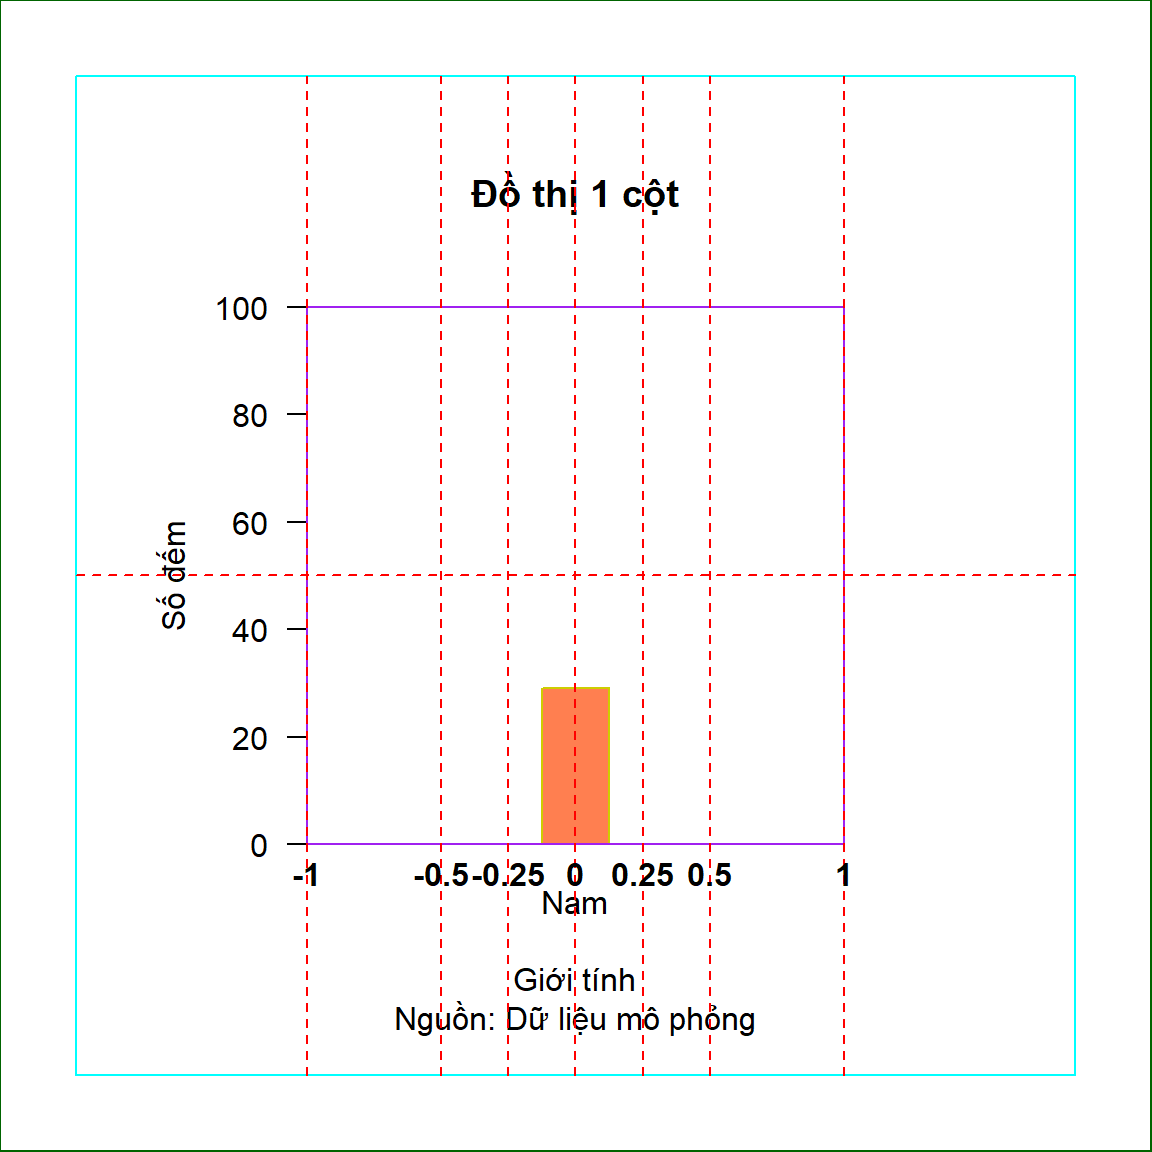
Đồ thị 1 cột gọn gàng
barplot(height = gender[1],
        las = 1,
        xlab = "Giới tính",
        ylab = "Số đếm",
        main = "Đồ thị 1 cột",
        sub = "Nguồn: Dữ liệu mô phỏng",
        xaxs = "i",
        yaxs = "i",
        col = c("coral"),
        xlim = c(-1, 1),
        # width = c(1), # mặc định là 1
        width = c(0.25),
        space = c(-0.5), # tương ứng là tọa độ ở -0.125
        ylim = c(0, 100),
        horiz = FALSE,
        beside = TRUE,
        border = c("yellow3")
)
box()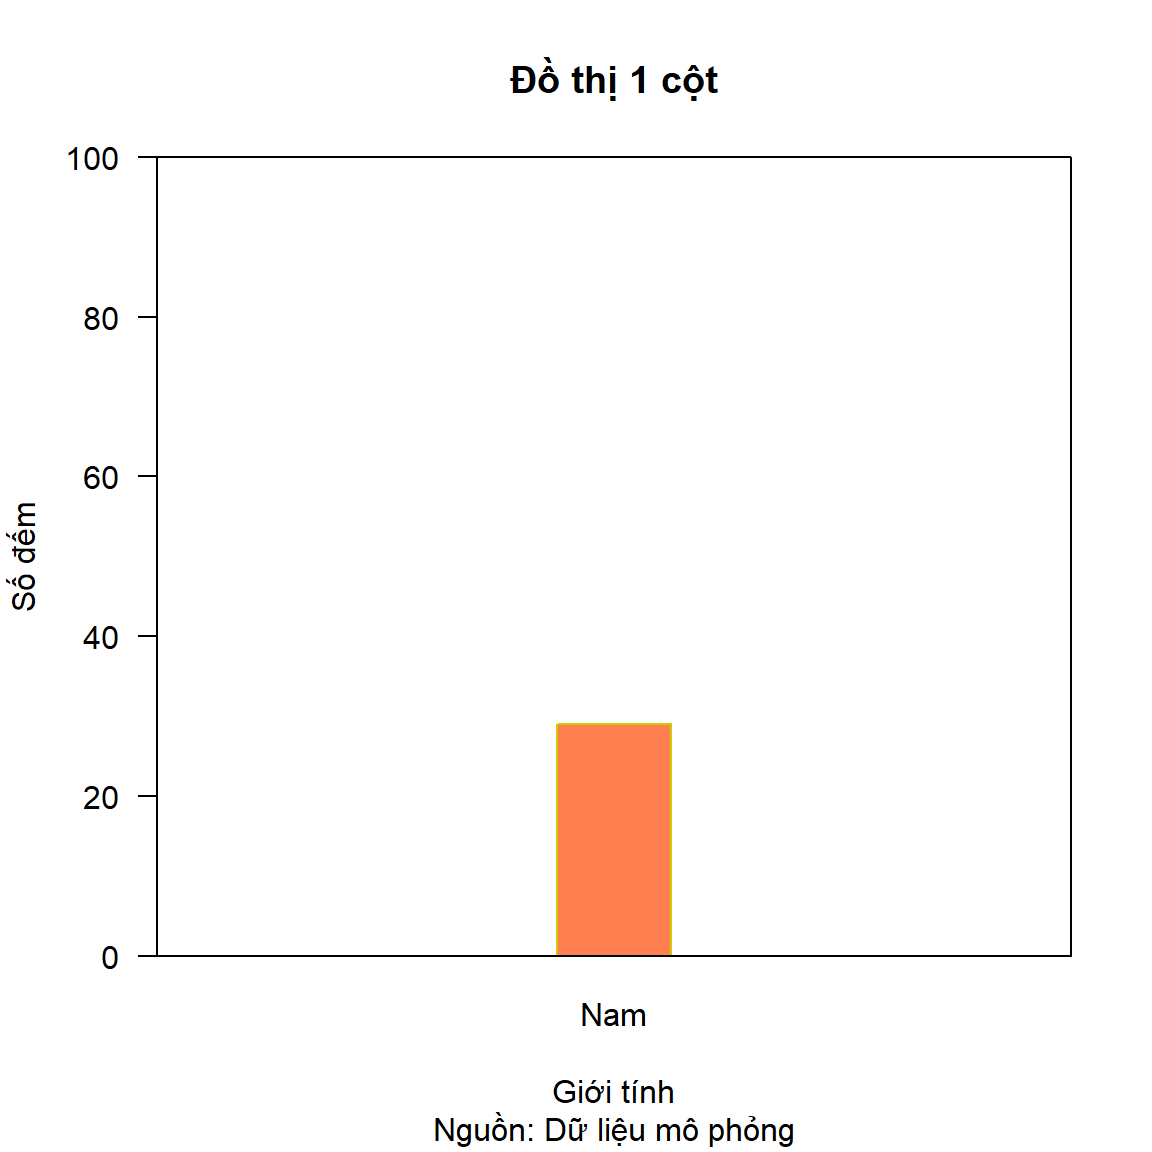
Thông số mặc định
par(pty = "s")
par(mar = c(6, 6, 6, 6))
par(oma = c(2, 2, 2, 2))
par(xpd = TRUE)


barplot(height = gender,
        las = 1,
        xlab = "Giới tính",
        ylab = "Số đếm",
        main = "Đồ thị 2 cột",
        sub = "Nguồn: Dữ liệu mô phỏng",
        xaxs = "i",
        yaxs = "i",
        ylim = c(0, 100)
)

par("usr")
[1] 0.2 2.4 0.0 100.0box(which = "plot", col = "purple")
box(which = "outer", col = "darkgreen")
box(which = "figure", col = "cyan")
abline(h = 50,
v = (par("usr")[1] + par("usr")[2])/2,
col = "red",
lty = 2)
text(x = (par("usr")[1] + par("usr")[2])/2,
y = 0,
labels = as.character((par("usr")[1] + par("usr")[2])/2),
pos = 1,
font = 2)
##
abline(v = par("usr")[1],
col = "red",
lty = 2)
text(x = par("usr")[1],
y = 0,
labels = as.character(par("usr")[1]),
pos = 1,
font = 2)
##
abline(v = par("usr")[2],
col = "red",
lty = 2)
text(x = par("usr")[2],
y = 0,
labels = as.character(par("usr")[2]),
pos = 1,
font = 2)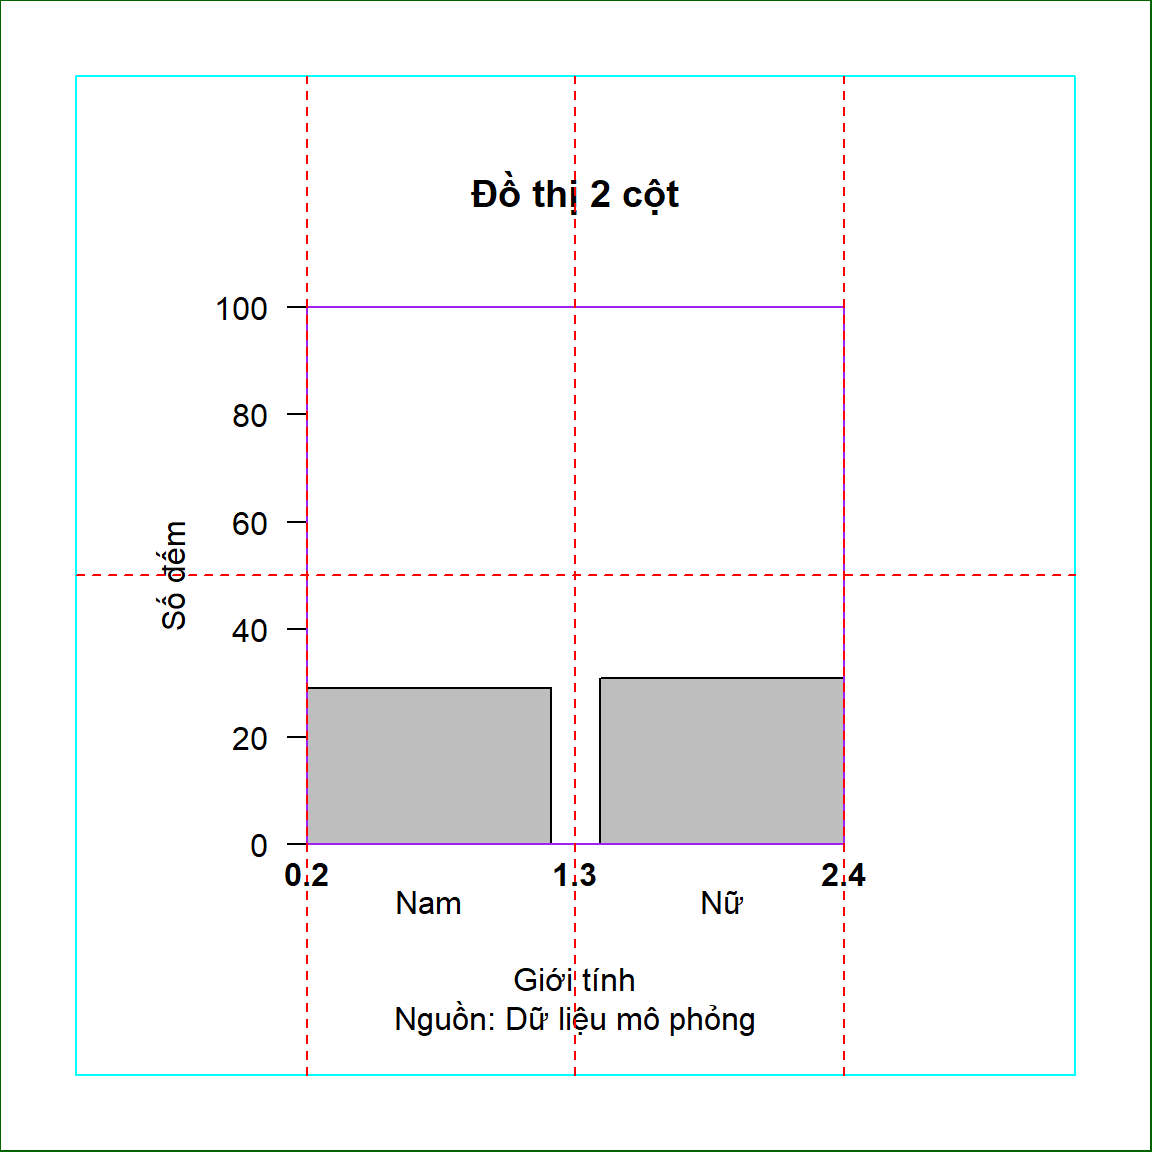
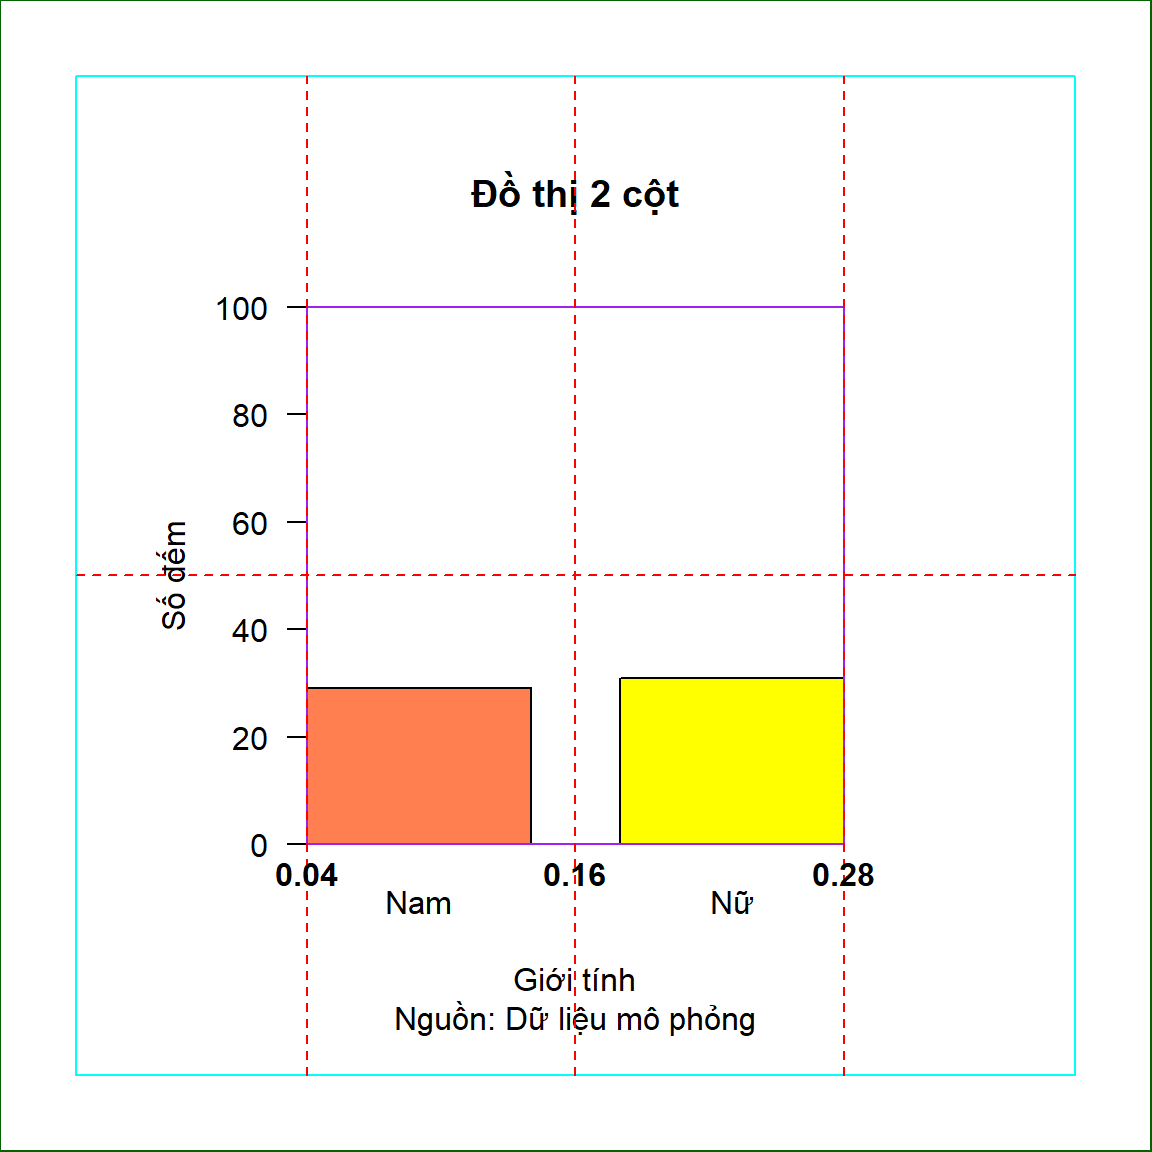
Nếu không set xlim thì dù thay đổi width và space như thế nào thì độ rộng cột vẫn không đổi (theo tỷ lệ hình).
par(pty = "s")
par(mar = c(6, 6, 6, 6))
par(oma = c(2, 2, 2, 2))
par(xpd = TRUE)


barplot(height = gender,
        las = 1,
        xlab = "Giới tính",
        ylab = "Số đếm",
        main = "Đồ thị 2 cột",
        sub = "Nguồn: Dữ liệu mô phỏng",
        xaxs = "i",
        yaxs = "i",
        ylim = c(0, 100), # không set xlim
        width = c(0.1, 0.1),
        space = c(0.4, 0.4),
        horiz = FALSE,
        beside = TRUE,
        col = c("coral", "yellow"),
        border = c("black", "black")
)

par("usr")
[1] 0.04 0.28 0.00 100.00box(which = "plot", col = "purple")
box(which = "outer", col = "darkgreen")
box(which = "figure", col = "cyan")
abline(h = 50,
v = (par("usr")[1] + par("usr")[2])/2,
col = "red",
lty = 2)
text(x = (par("usr")[1] + par("usr")[2])/2,
y = 0,
labels = as.character((par("usr")[1] + par("usr")[2])/2),
pos = 1,
font = 2)
##
abline(v = par("usr")[1],
col = "red",
lty = 2)
text(x = par("usr")[1],
y = 0,
labels = as.character(par("usr")[1]),
pos = 1,
font = 2)
##
abline(v = par("usr")[2],
col = "red",
lty = 2)
text(x = par("usr")[2],
y = 0,
labels = as.character(par("usr")[2]),
pos = 1,
font = 2)
Khi set xlim thì thay đổi được chiều rộng của cột.
par(pty = "s")
par(mar = c(6, 6, 6, 6))
par(oma = c(2, 2, 2, 2))
par(xpd = TRUE)


barplot(height = gender,
        las = 1,
        xlab = "Giới tính",
        ylab = "Số đếm",
        main = "Đồ thị 2 cột",
        sub = "Nguồn: Dữ liệu mô phỏng",
        xaxs = "i",
        yaxs = "i",
        ylim = c(0, 100), # không set xlim
        width = c(0.1, 0.1),
        space = c(0.4, 0.4),
        horiz = FALSE,
        beside = TRUE,
        col = c("coral", "yellow"),
        border = c("black", "black")
)

par("usr")
[1] 0.04 0.28 0.00 100.00box(which = "plot", col = "purple")
box(which = "outer", col = "darkgreen")
box(which = "figure", col = "cyan")
abline(h = 50,
v = (par("usr")[1] + par("usr")[2])/2,
col = "red",
lty = 2)
text(x = (par("usr")[1] + par("usr")[2])/2,
y = 0,
labels = as.character((par("usr")[1] + par("usr")[2])/2),
pos = 1,
font = 2)
##
abline(v = par("usr")[1],
col = "red",
lty = 2)
text(x = par("usr")[1],
y = 0,
labels = as.character(par("usr")[1]),
pos = 1,
font = 2)
##
abline(v = par("usr")[2],
col = "red",
lty = 2)
text(x = par("usr")[2],
y = 0,
labels = as.character(par("usr")[2]),
pos = 1,
font = 2)