Câu hỏi nghiên cứu: Xác định tổ hợp giữa cơ chất và vi sinh vật để thu được hoạt tính enzyme cao
Bước 1: Import dữ liệu
library (readxl)<- readxl:: read_excel ("activity.xlsx" , col_names = TRUE )<- as.data.frame (enzyme_df)
     substrate bacillus  enzyme
1  substrate_a     AB12 26.4125
2  substrate_a     AB12 32.4125
3  substrate_a     AB12 27.3000
4  substrate_b     AB12 12.7500
5  substrate_b     AB12 11.9625
6  substrate_b     AB12  8.9500
7  substrate_c     AB12 23.2000
8  substrate_c     AB12 25.8625
9  substrate_c     AB12 24.2750
10 substrate_d     AB12 48.1375
11 substrate_d     AB12 45.9125
12 substrate_d     AB12 47.7750
13 substrate_e     AB12 43.7250
14 substrate_e     AB12 44.6000
15 substrate_e     AB12 42.3875
16 substrate_a     CD47 32.2750
17 substrate_a     CD47 30.2250
18 substrate_a     CD47 32.5125
19 substrate_b     CD47 10.4750
20 substrate_b     CD47  9.9250
21 substrate_b     CD47 10.0375
22 substrate_c     CD47 15.4625
23 substrate_c     CD47 19.7250
24 substrate_c     CD47 17.9125
25 substrate_d     CD47 24.0625
26 substrate_d     CD47 25.4750
27 substrate_d     CD47 24.8375
28 substrate_e     CD47 22.6500
29 substrate_e     CD47 22.1625
30 substrate_e     CD47 21.5500
31 substrate_a     ER12 40.2375
32 substrate_a     ER12 36.1750
33 substrate_a     ER12 39.2125
34 substrate_b     ER12 14.7250
35 substrate_b     ER12 15.1750
36 substrate_b     ER12 16.0625
37 substrate_c     ER12 20.1875
38 substrate_c     ER12 21.5125
39 substrate_c     ER12 21.7250
40 substrate_d     ER12 53.1875
41 substrate_d     ER12 53.1000
42 substrate_d     ER12 52.5750
43 substrate_e     ER12 45.6625
44 substrate_e     ER12 45.3625
45 substrate_e     ER12 44.7000
46 substrate_a     MS16 36.1500
47 substrate_a     MS16 35.0625
48 substrate_a     MS16 33.5375
49 substrate_b     MS16 16.5250
50 substrate_b     MS16 21.4375
51 substrate_b     MS16 18.6750
52 substrate_c     MS16 25.1875
53 substrate_c     MS16 25.5375
54 substrate_c     MS16 26.6250
55 substrate_d     MS16 43.2500
56 substrate_d     MS16 43.6000
57 substrate_d     MS16 40.4625
58 substrate_e     MS16 52.4125
59 substrate_e     MS16 52.9375
60 substrate_e     MS16 53.0125
table (enzyme_df$ substrate, enzyme_df$ bacillus)
              AB12 CD47 ER12 MS16
  substrate_a    3    3    3    3
  substrate_b    3    3    3    3
  substrate_c    3    3    3    3
  substrate_d    3    3    3    3
  substrate_e    3    3    3    3
Chuyển dạng factor cho các biến substrate và bacillus.
$ substrate <- as.factor (enzyme_df$ substrate)$ bacillus <- as.factor (enzyme_df$ bacillus)
Bước 2: Giả thuyết cho ANOVA 2 yếu tố
Nguồn: https://statistics.laerd.com/spss-tutorials/two-way-anova-using-spss-statistics.php
Assumption #1: Your dependent variable should be measured at the continuous level \(\Rightarrow\) OK
Assumption #2: Your two independent variables should each consist of two or more categorical, independent groups \(\Rightarrow\) OK
Assumption #3: You should have independence of observations, which means that there is no relationship between the observations in each group or between the groups themselves. \(\Rightarrow\) OK
Assumption #4: There should be no significant outliers.
Assumption #5: Your dependent variable should be approximately normally distributed for each combination of the groups of the two independent variables.
Assumption #6: There needs to be homogeneity of variances for each combination of the groups of the two independent variables. Again, whilst this sounds a little tricky, you can easily test this assumption in SPSS Statistics using Levene’s test for homogeneity of variances.
Bước 3: Kiểm tra giả thuyết cho ANOVA
Bước 3.1: Kiểm tra giả thuyết Assumption #5 normally distributed for each combination of the groups
# Compute two-way ANOVA test with interaction effect <- aov (enzyme ~ substrate * bacillus, data = enzyme_df)<- residuals (object = res.aov)shapiro.test (x = aov_residuals)
    Shapiro-Wilk normality test

data:  aov_residuals
W = 0.96772, p-value = 0.1127
Kết quả Shapiro-Wilk normality test cho thấy p-value là 0.1127 lớn hơn 0.05. Do đó bộ dataset này có sự phân bố chuẩn \(\Rightarrow\) OK
https://en.wikipedia.org/wiki/Shapiro%E2%80%93Wilk_test
The Shapiro–Wilk test is a test of normality. The null-hypothesis of this test is that the population is normally distributed. Thus, if the p value is less than the chosen alpha level, then the null hypothesis is rejected and there is evidence that the data tested are not normally distributed. On the other hand, if the p value is greater than the chosen alpha level, then the null hypothesis (that the data came from a normally distributed population) can not be rejected (e.g., for an alpha level of .05, a data set with a p value of less than .05 rejects the null hypothesis that the data are from a normally distributed population – consequently, a data set with a p value more than the .05 alpha value fails to reject the null hypothesis that the data is from a normally distributed population).
Tóm lại trong Shapiro–Wilk test thì p-value nhỏ hơn 0.05 thì KHÔNG có phân bố chuẩn (do đó vi phạm giả thuyết). p-value lớn hơn 0.05 thì CÓ phân bố chuẩn.
Bước 3.2: Kiểm tra giả thuyết Assumption #6 homogeneity of variances
library (car)leveneTest (enzyme ~ substrate * bacillus, data = enzyme_df)
Levene's Test for Homogeneity of Variance (center = median)
      Df F value Pr(>F)
group 19  0.6694 0.8254
      40
Kết quả Levene’s test cho thấy p-value là 0.8254 lớn hơn 0.05. Do đó bộ dataset này có không có sự khác biệt về phương sai giữa các tổ hợp các mức khác nhau của 2 biến \(\Rightarrow\) OK
https://en.wikipedia.org/wiki/Levene%27s_test
In statistics, Levene’s test is an inferential statistic used to assess the equality of variances for a variable calculated for two or more groups. Some common statistical procedures assume that variances of the populations from which different samples are drawn are equal. Levene’s test assesses this assumption. It tests the null hypothesis that the population variances are equal (called homogeneity of variance or homoscedasticity). If the resulting p-value of Levene’s test is less than some significance level (typically 0.05), the obtained differences in sample variances are unlikely to have occurred based on random sampling from a population with equal variances. Thus, the null hypothesis of equal variances is rejected and it is concluded that there is a difference between the variances in the population.
Tóm lại trong Levene’s test thì p-value nhỏ hơn 0.05 thì CÓ sự khác biệt về phương sai giữa các tổ hợp yếu tố (do đó vi phạm giả thuyết). p-value lớn hơn 0.05 thì KHÔNG CÓ sự khác biệt về phương sai giữa các tổ hợp các mức của 2 yếu tố.
Bước 3.3: Kiểm tra giả thuyết Assumption #4 kiểm tra outlier
Có nhiều phương pháp để detect outliers trong dataset.
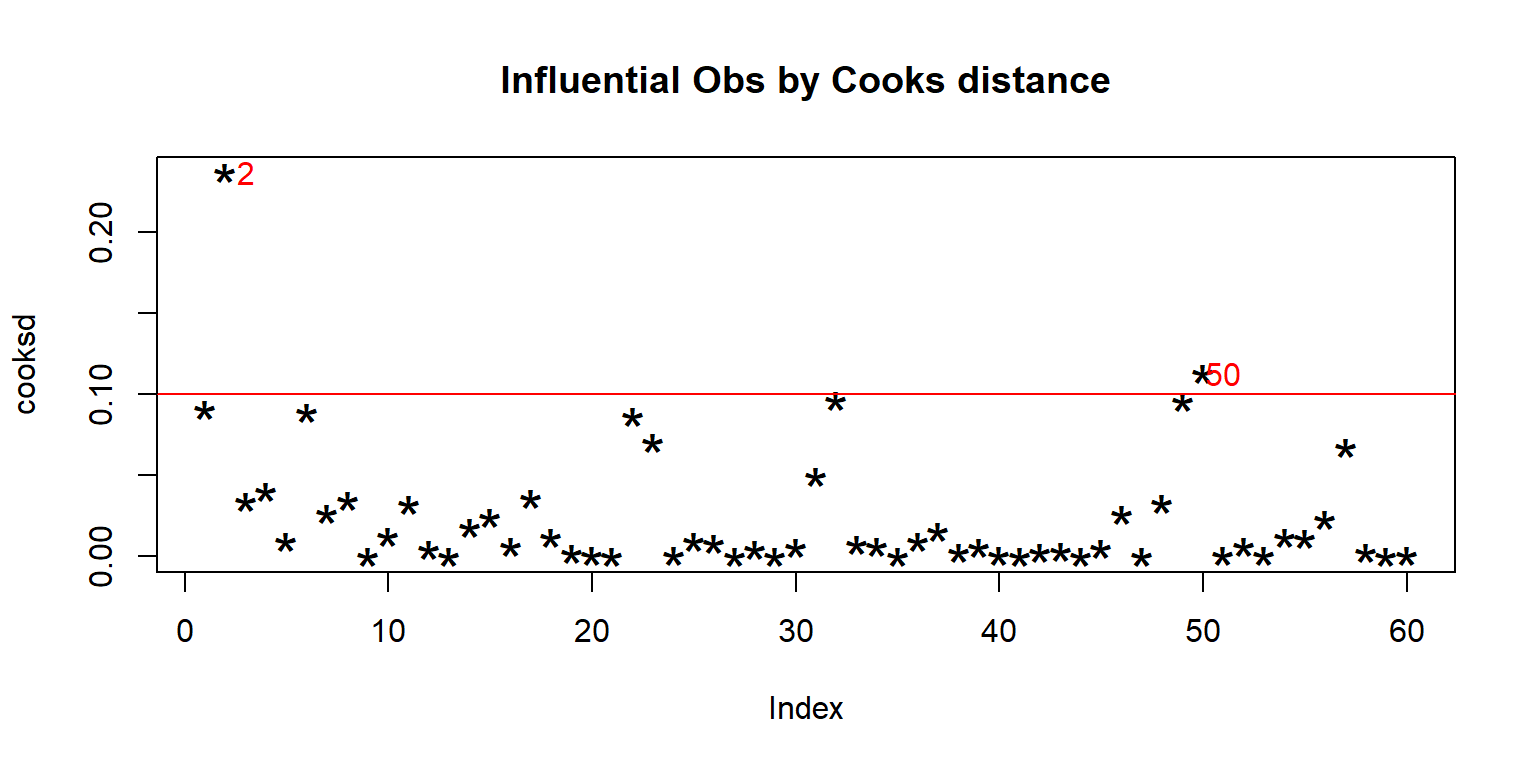
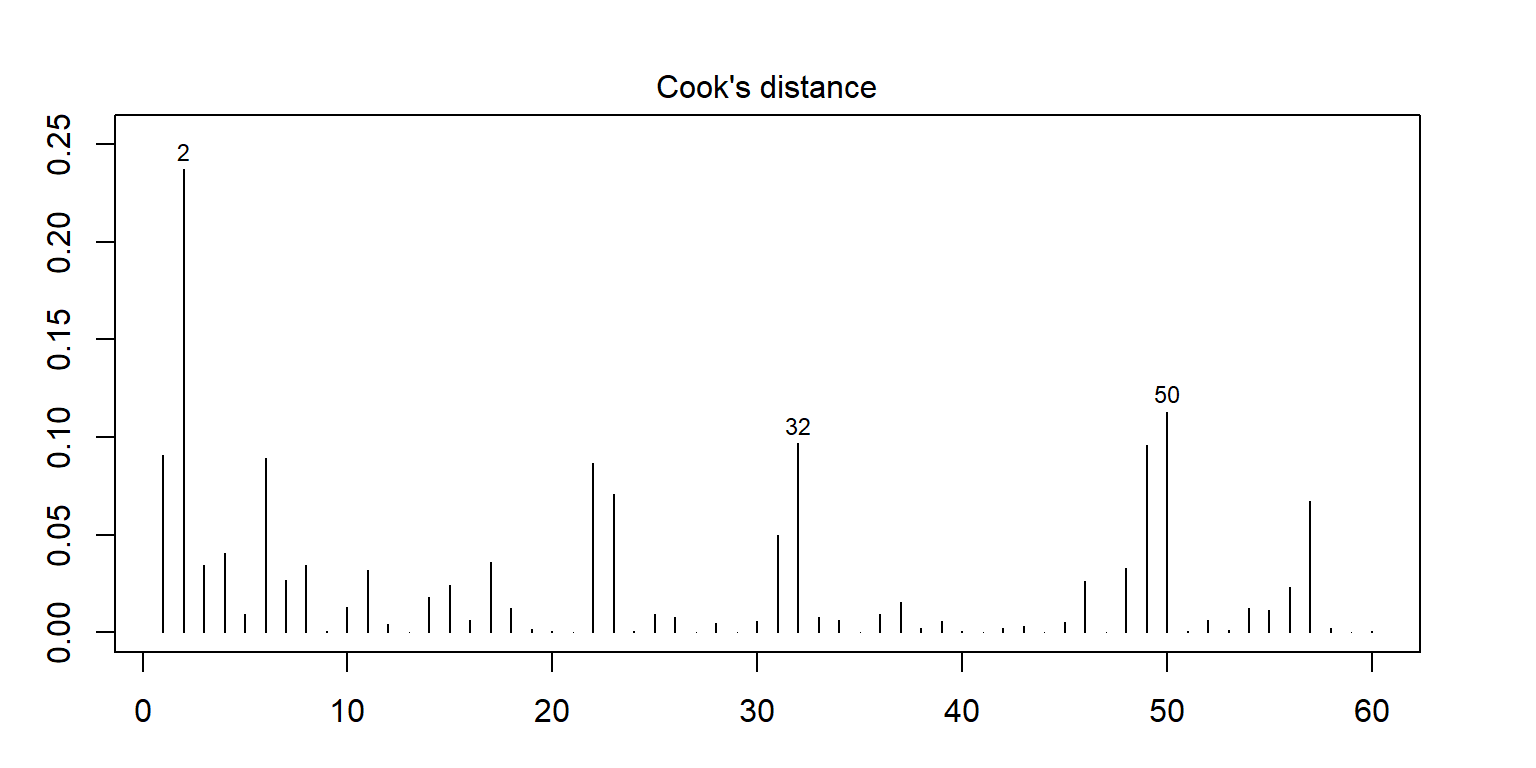
Cách 1: Multivariate Model Approach - Cook’s Distance
<- lm (enzyme ~ substrate * bacillus, data = enzyme_df)<- cooks.distance (mod)plot (cooksd, pch = "*" , cex = 2 , main = "Influential Obs by Cooks distance" ) # plot cook's distance abline (h = 4 * mean (cooksd, na.rm = TRUE ), col= "red" ) # add cutoff line text (x = 1 : length (cooksd) + 1 , y = cooksd, labels = ifelse (cooksd > 4 * mean (cooksd, na.rm = TRUE ),names (cooksd), "" ), col = "red" ) # add labels <- cooksd > 4 * mean (cooksd, na.rm = TRUE )## giá trị outlier
     substrate bacillus  enzyme
2  substrate_a     AB12 32.4125
50 substrate_b     MS16 21.4375
Cách 2: Dùng function car::outlierTest
library (car):: outlierTest (mod) -> ok# names(ok$p) names (ok$ p), ] ## giá trị outlier
    substrate bacillus  enzyme
2 substrate_a     AB12 32.4125
Cách 3: Dùng package outliers
### sử dụng function outlier() cho vector enzyme activity library (outliers):: outlier (enzyme_df$ enzyme, opposite = TRUE ) -> yes_1|> subset (enzyme == yes_1) # vị trí outlier
    substrate bacillus enzyme
6 substrate_b     AB12   8.95
### sử dụng function scores() cho vector enzyme activity # outliers::scores(enzyme_df$enzyme, type = "chisq", prob = 0.95) # outliers::scores(enzyme_df$enzyme, type = "t", prob = 0.95) :: scores (enzyme_df$ enzyme, type = "z" , prob = 0.95 ) -> yes_2
     substrate bacillus  enzyme
40 substrate_d     ER12 53.1875
41 substrate_d     ER12 53.1000
42 substrate_d     ER12 52.5750
58 substrate_e     MS16 52.4125
59 substrate_e     MS16 52.9375
60 substrate_e     MS16 53.0125
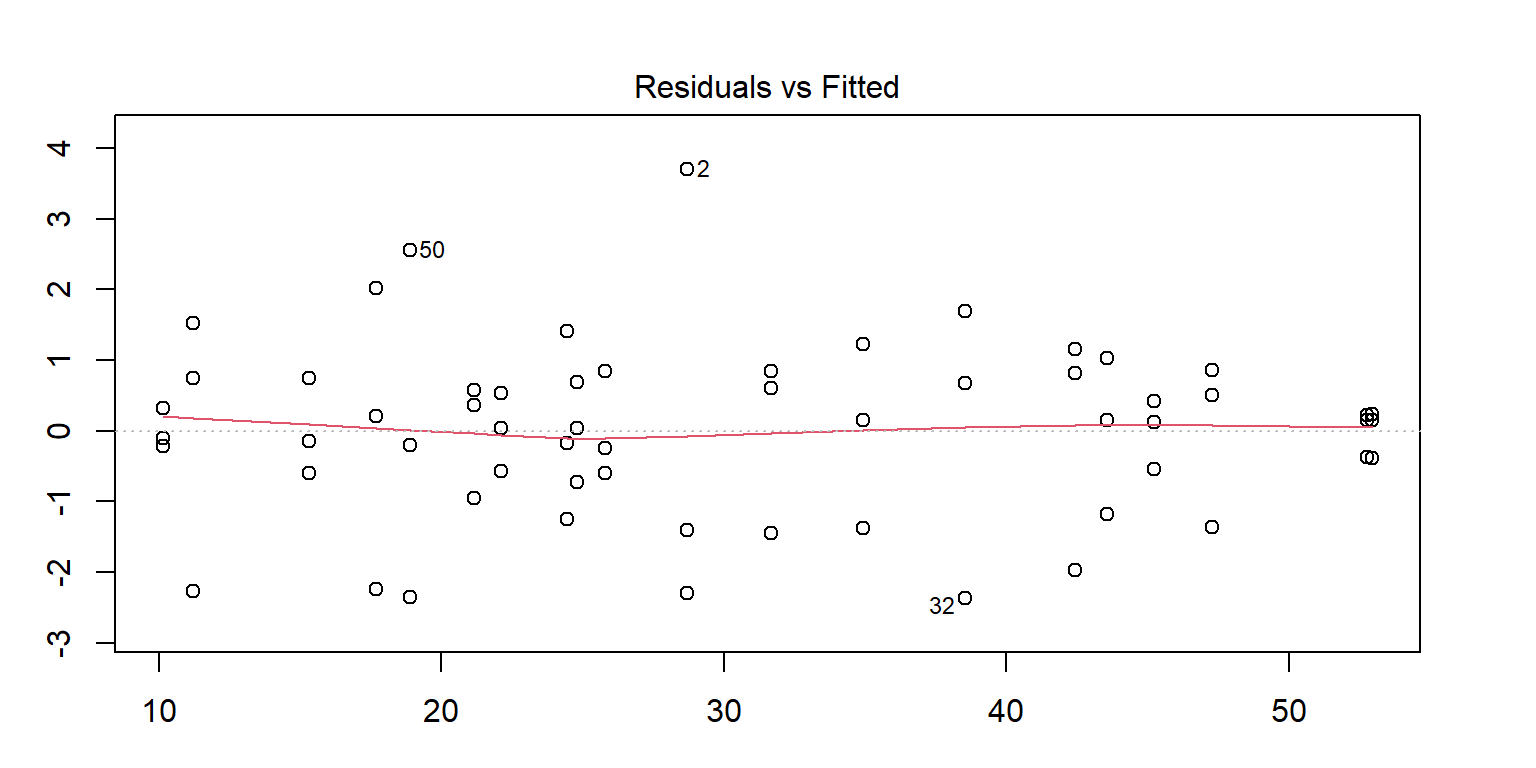
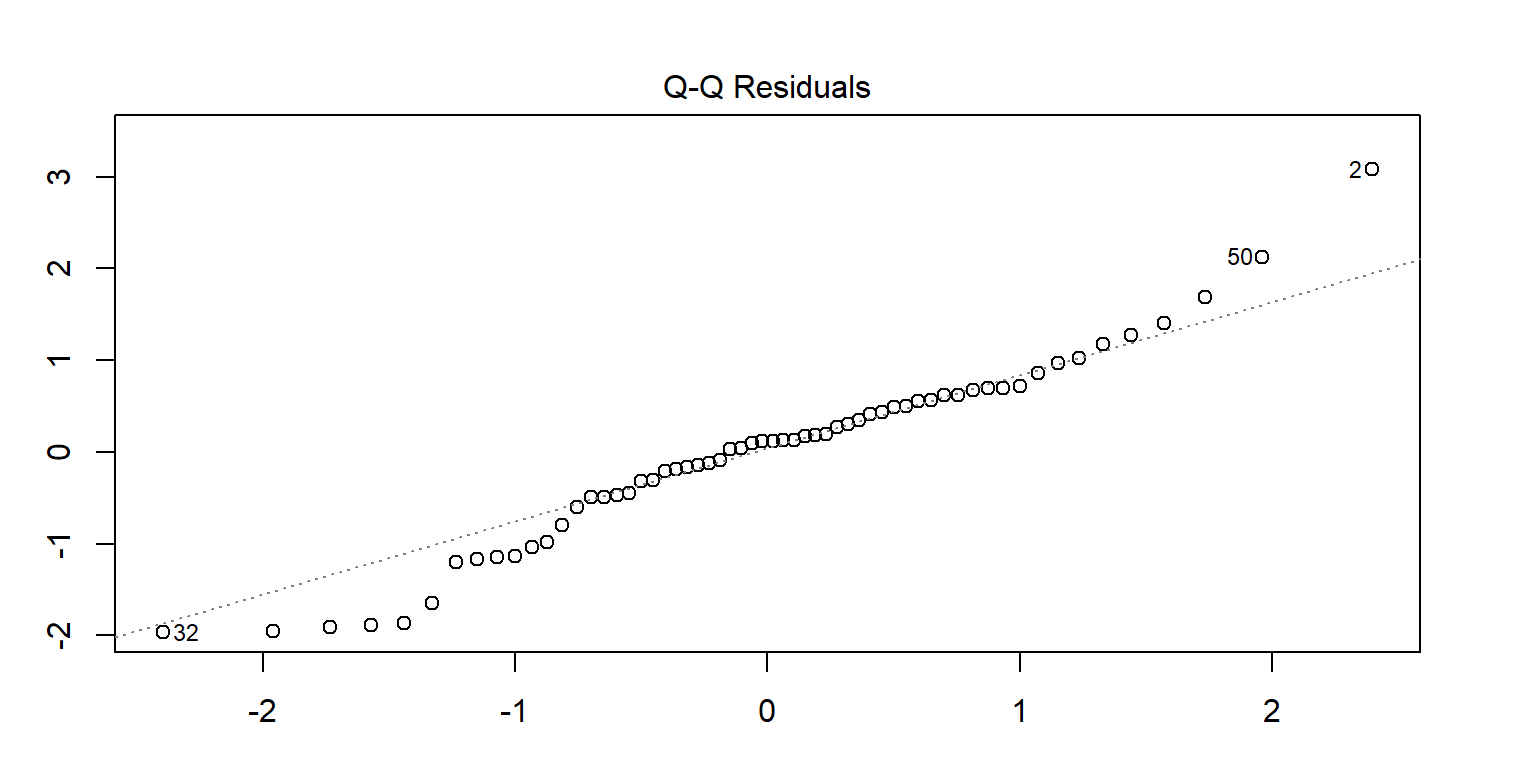
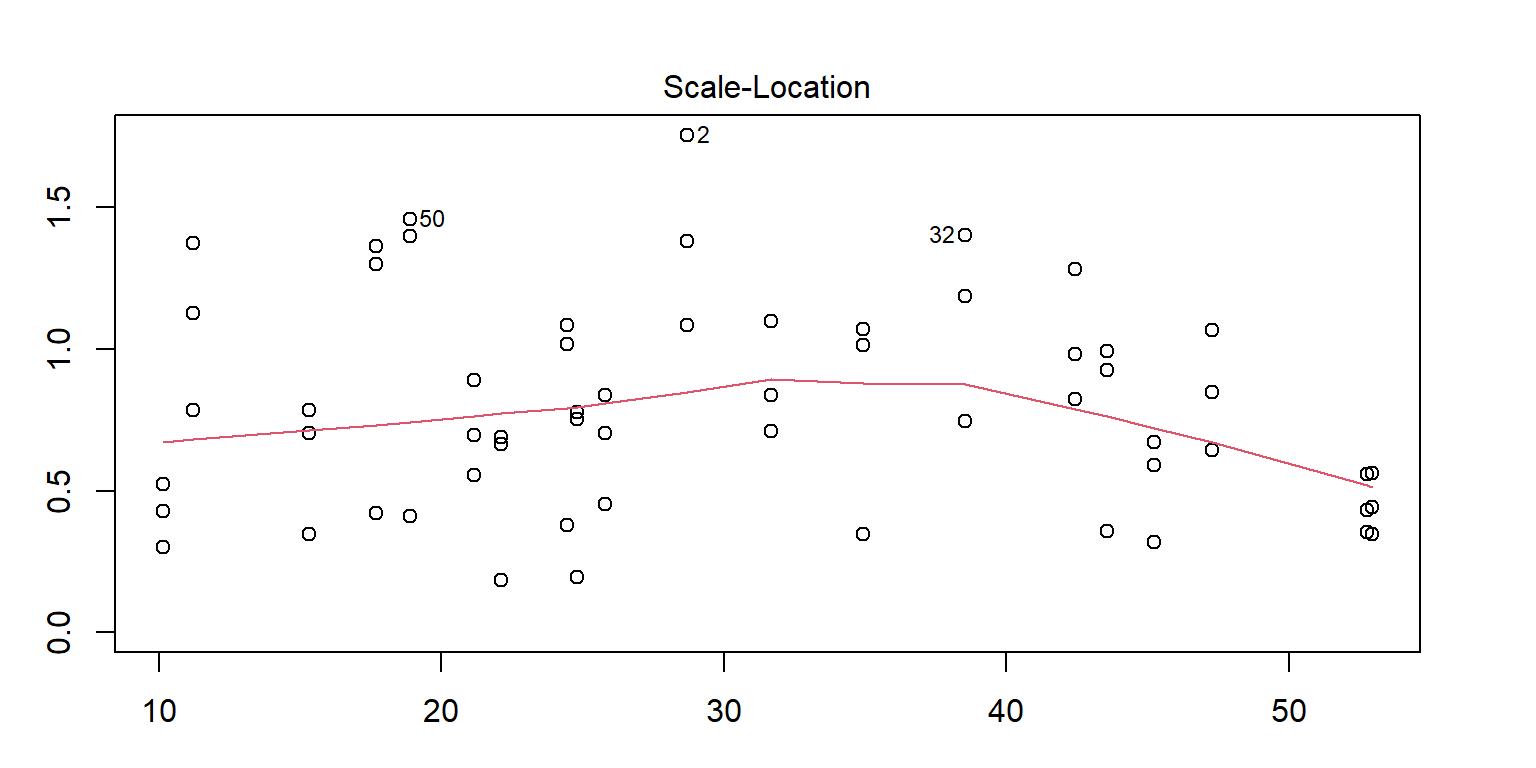
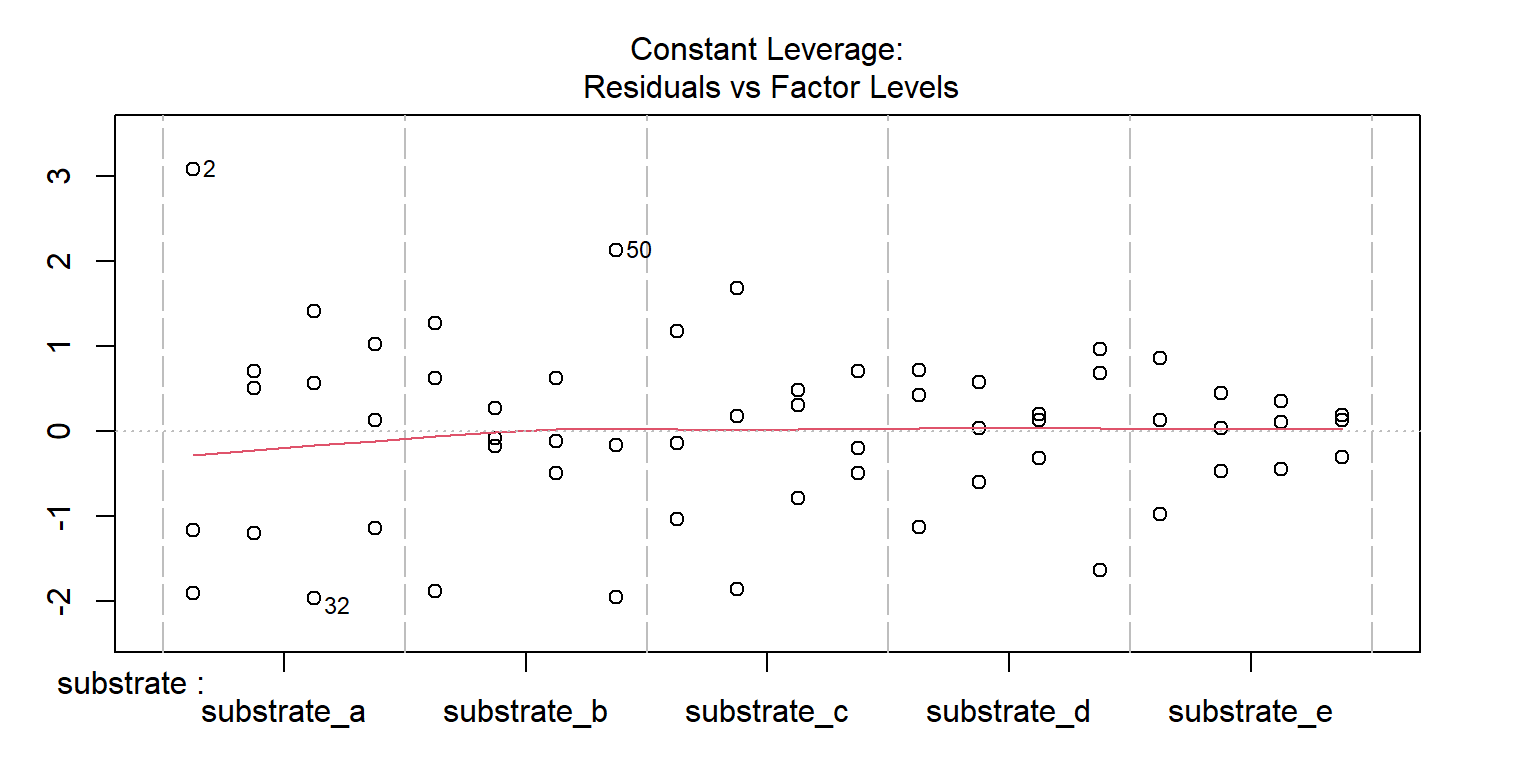
Cách 4: Dùng đồ thị Q-Q plot
<- lm (enzyme ~ substrate * bacillus, data = enzyme_df)par (mar = c (3 , 3 , 3 , 3 ))plot (mod, 1 )# sort(abs(residuals(mod)), decreasing = TRUE) # save the residuals c (2 , 32 , 50 ), ]
     substrate bacillus  enzyme
2  substrate_a     AB12 32.4125
32 substrate_a     ER12 36.1750
50 substrate_b     MS16 21.4375
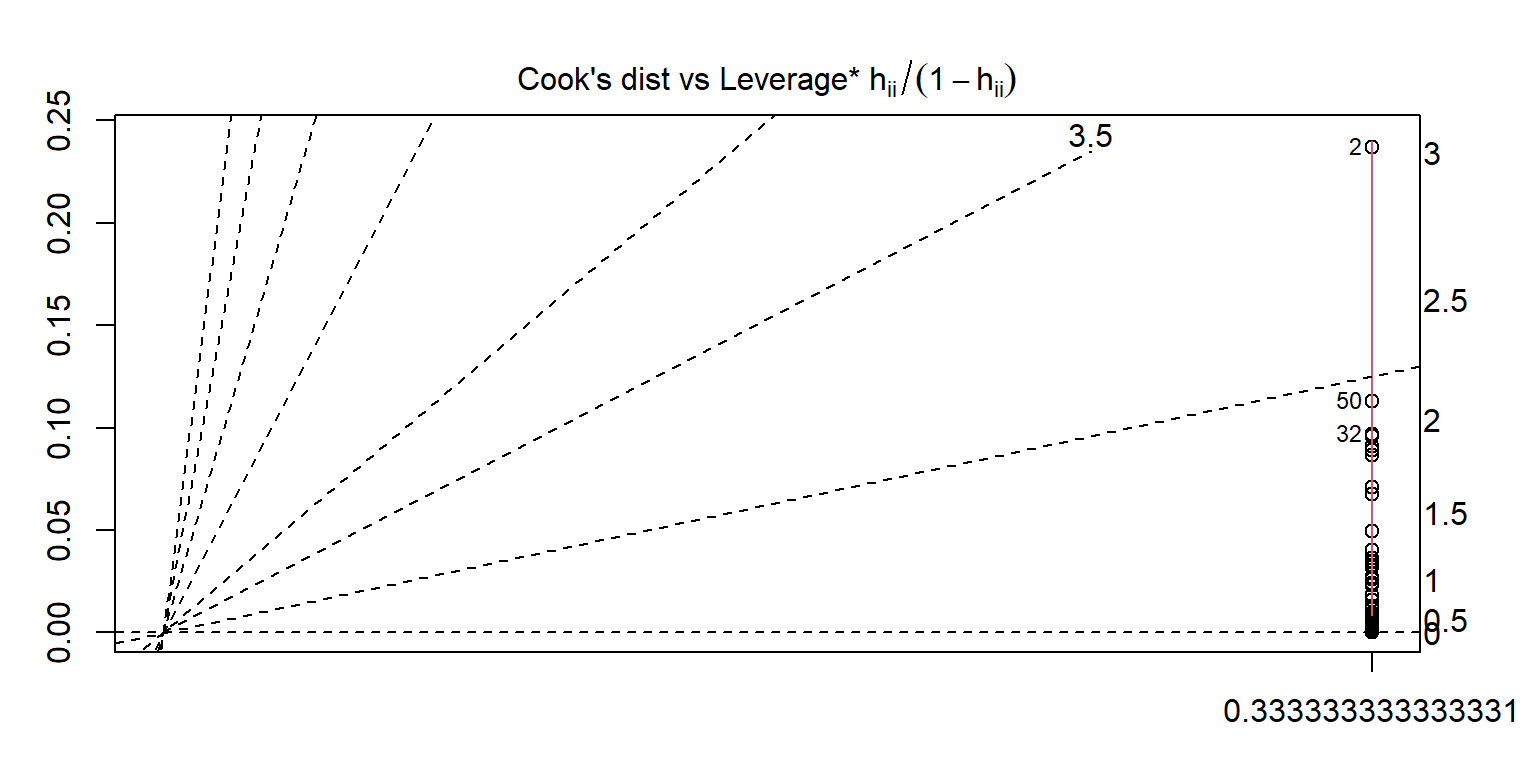
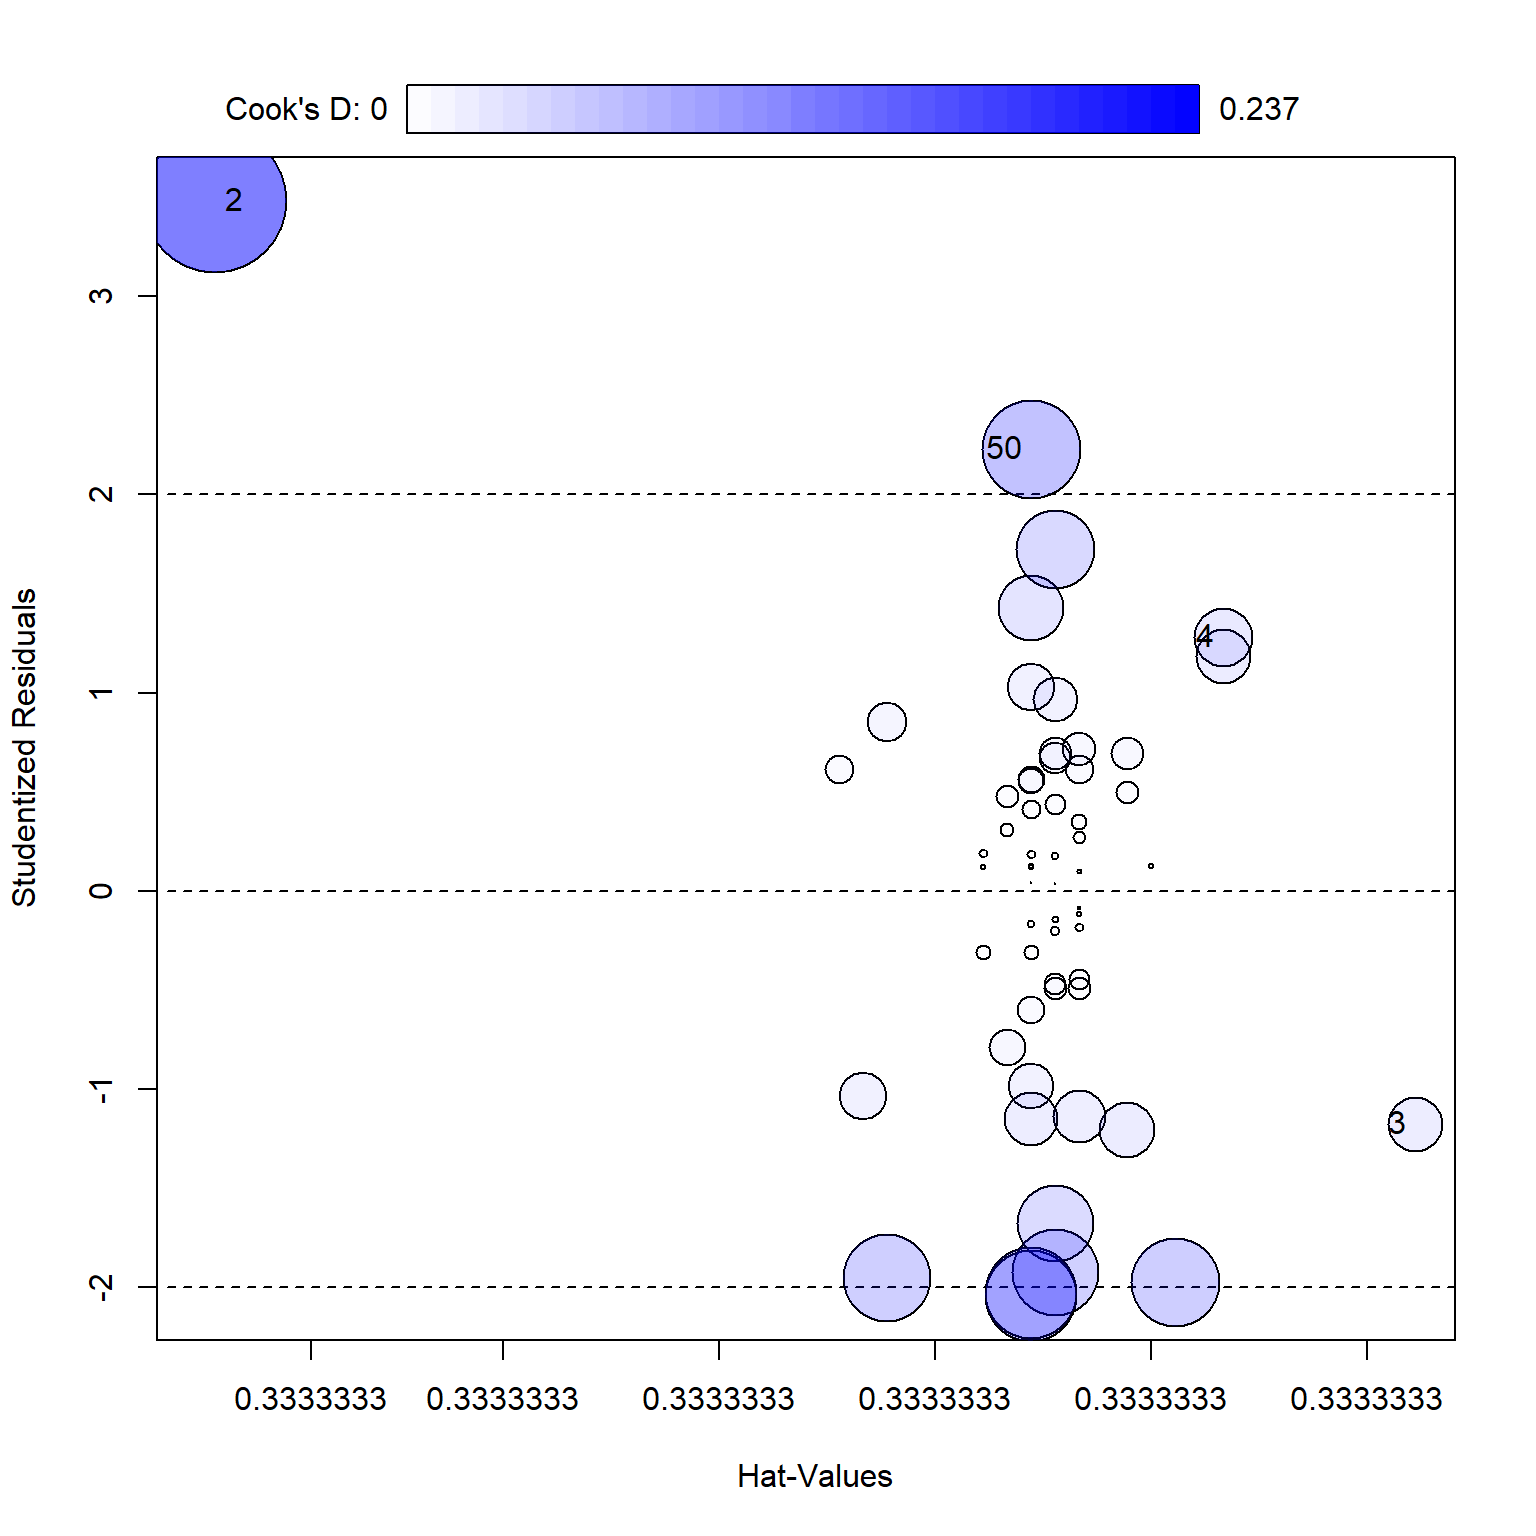
Cách 5: Dùng function car::influencePlot
library (car)<- car:: influencePlot (mod)row.names (outs), ]
     substrate bacillus  enzyme
2  substrate_a     AB12 32.4125
3  substrate_a     AB12 27.3000
4  substrate_b     AB12 12.7500
50 substrate_b     MS16 21.4375
Bước 4: Kiểm tra đặc điểm dữ liệu
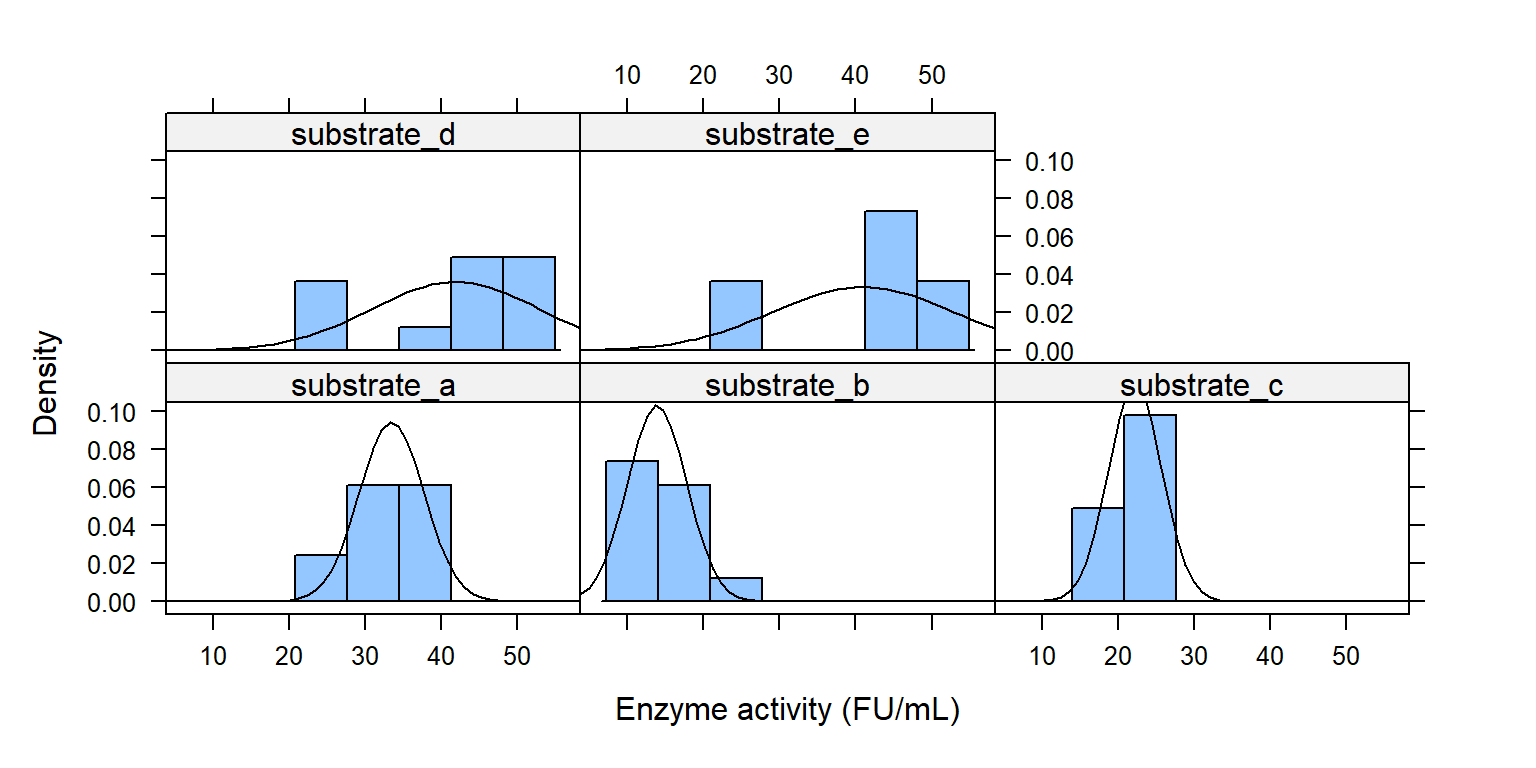
Histogram theo các mức trong substrate
library (lattice)histogram ( ~ enzyme | substrate, data = enzyme_df,xlab = "Enzyme activity (FU/mL)" , type = "density" ,panel = function (x, ...) {panel.histogram (x, ...)panel.mathdensity (dmath = dnorm, col = "black" ,args = list (mean= mean (x),sd= sd (x)))
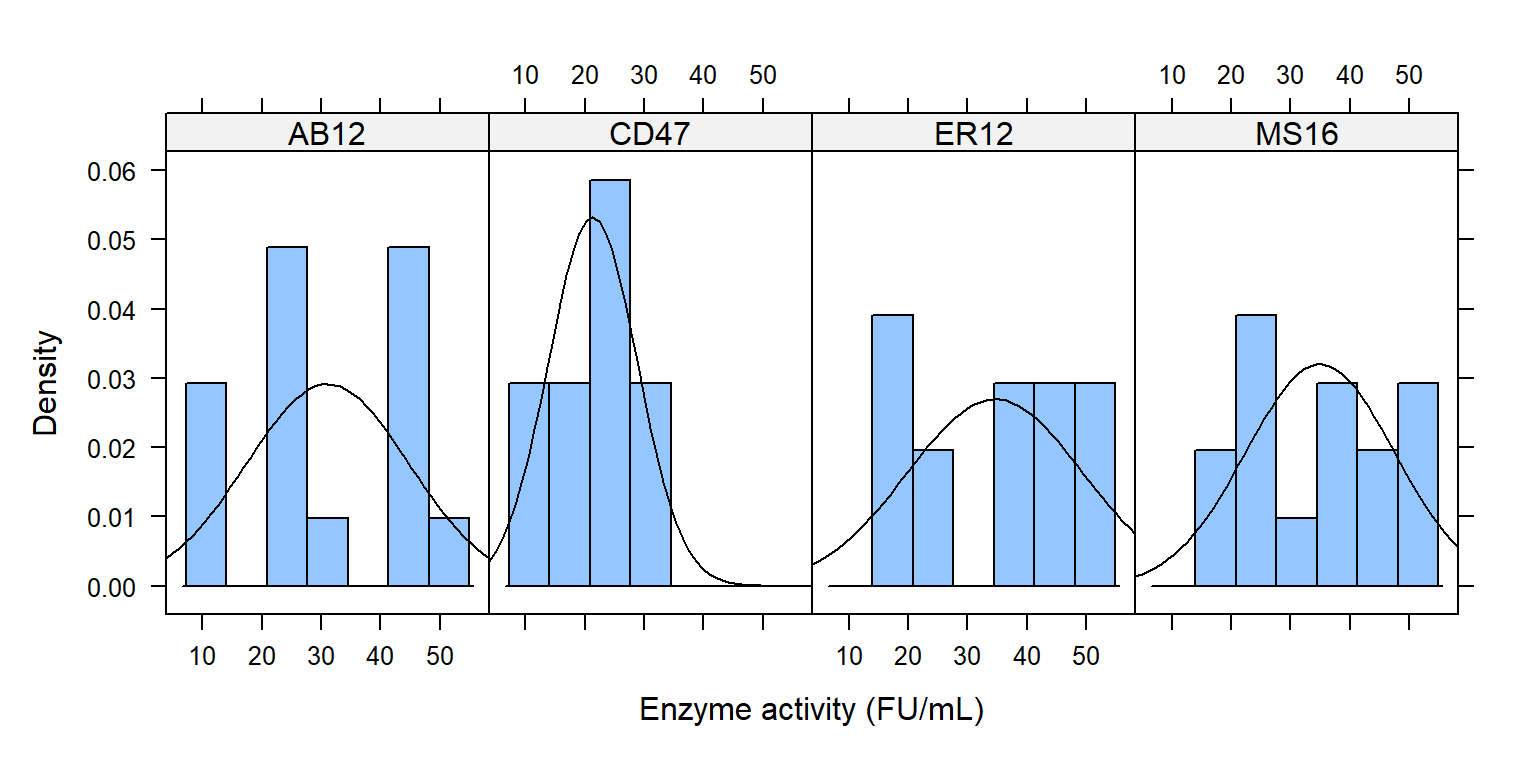
Histogram theo các mức trong bacillus
library (lattice)histogram ( ~ enzyme | bacillus, data = enzyme_df,xlab = "Enzyme activity (FU/mL)" , type = "density" ,panel = function (x, ...) {panel.histogram (x, ...)panel.mathdensity (dmath = dnorm, col = "black" ,args = list (mean= mean (x),sd= sd (x)))
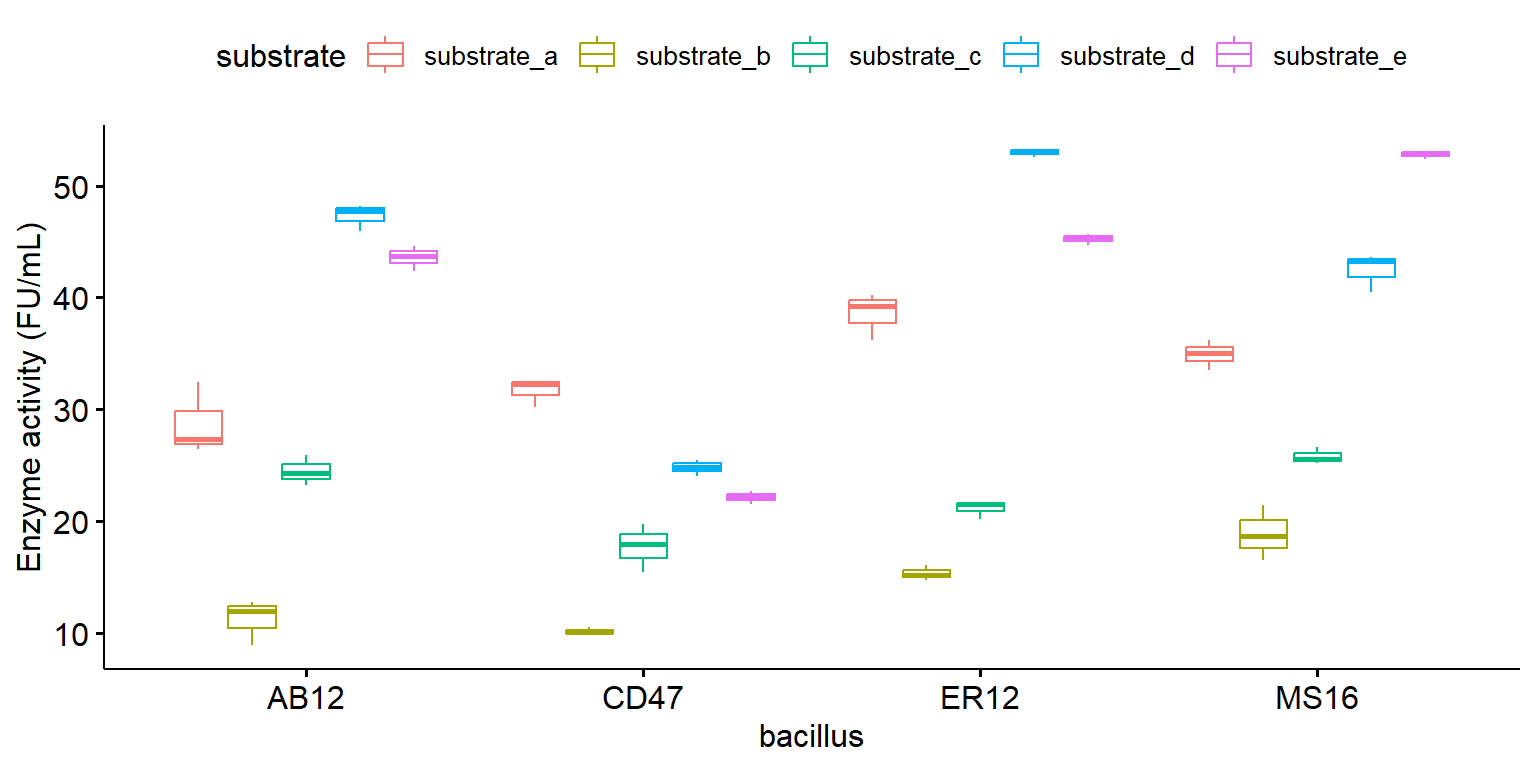
Boxplot với tổ hợp các nghiệm thức
library (ggpubr)ggboxplot (enzyme_df, x = "bacillus" , y = "enzyme" , color = "substrate" , ylab = "Enzyme activity (FU/mL)" )
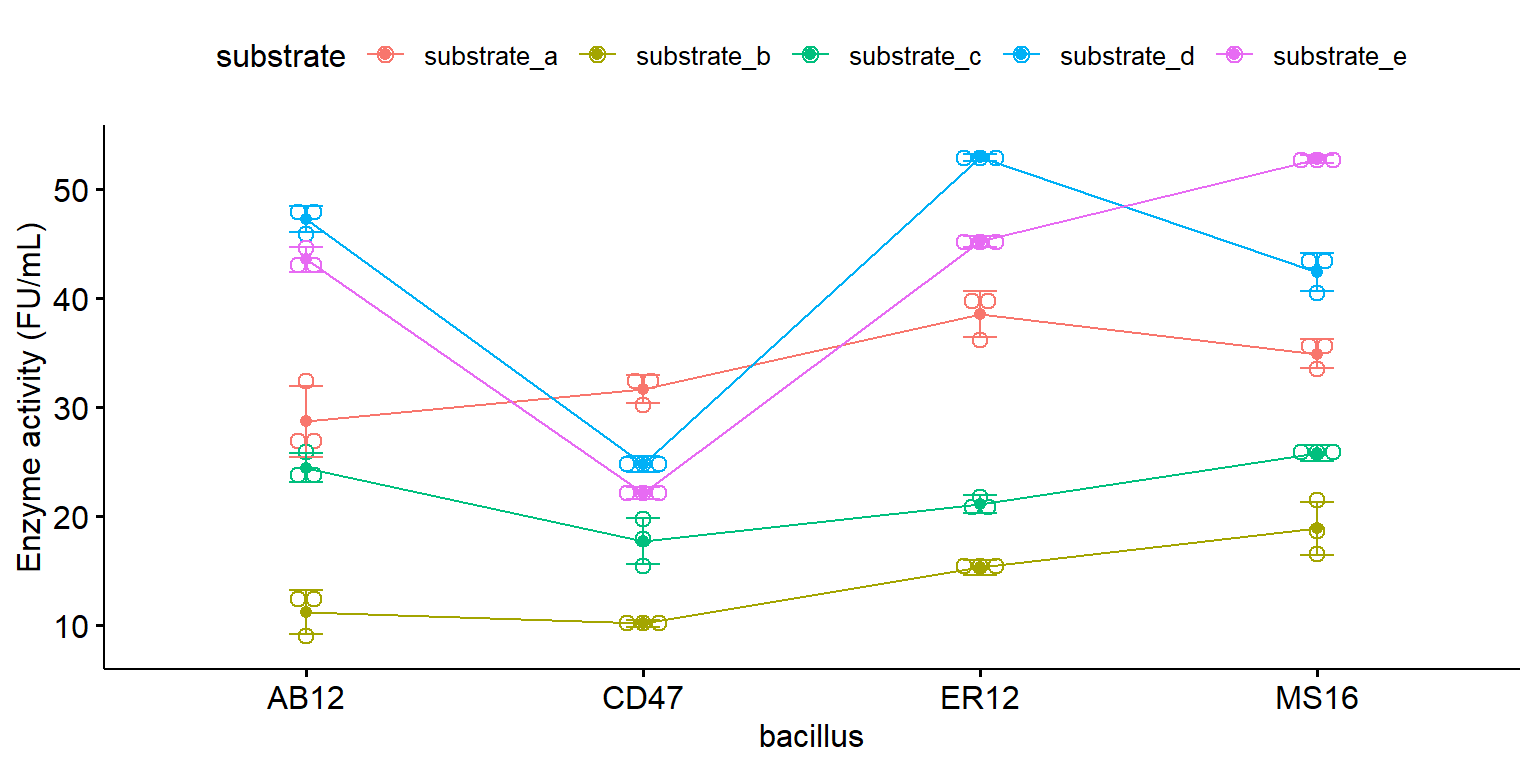
Lineplot với tổ hợp các nghiệm thức
library ("ggpubr" )ggline (enzyme_df, x = "bacillus" , y = "enzyme" , color = "substrate" , ylab = "Enzyme activity (FU/mL)" ,add = c ("mean_sd" , "dotplot" ))
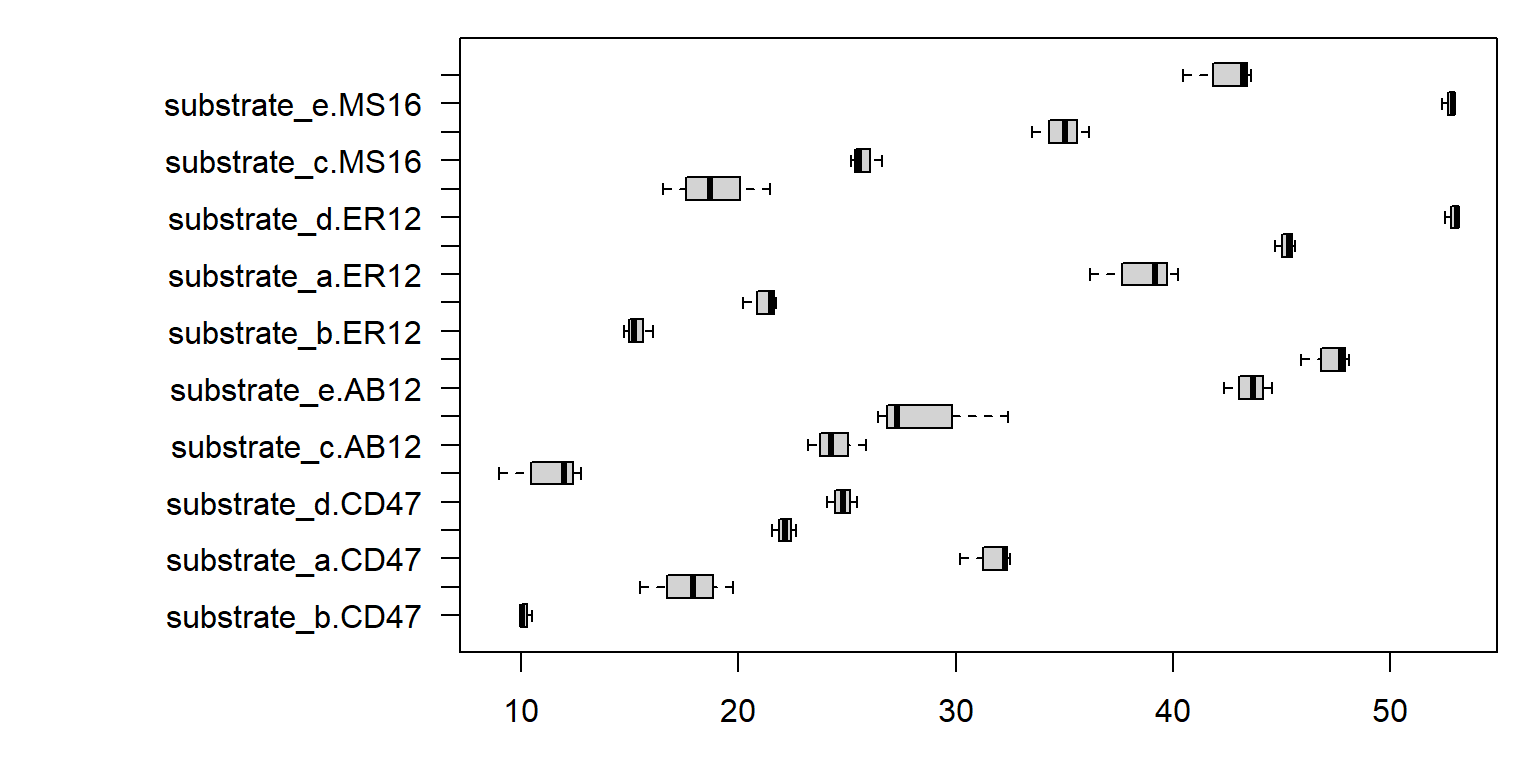
Box plot with two factor variables
$ substrate <- reorder (enzyme_df$ substrate, enzyme_df$ enzyme, decreasing = FALSE ) $ bacillus <- reorder (enzyme_df$ bacillus, enzyme_df$ enzyme, decreasing = FALSE ) par (mar = c (3 , 12 , 1 , 1 ))boxplot (enzyme ~ substrate * bacillus, data = enzyme_df, frame = TRUE ,horizontal = TRUE , las = 1 ,axisnames = TRUE , ylab = "" , xlab = "Enzyme activity (FU/mL)" )
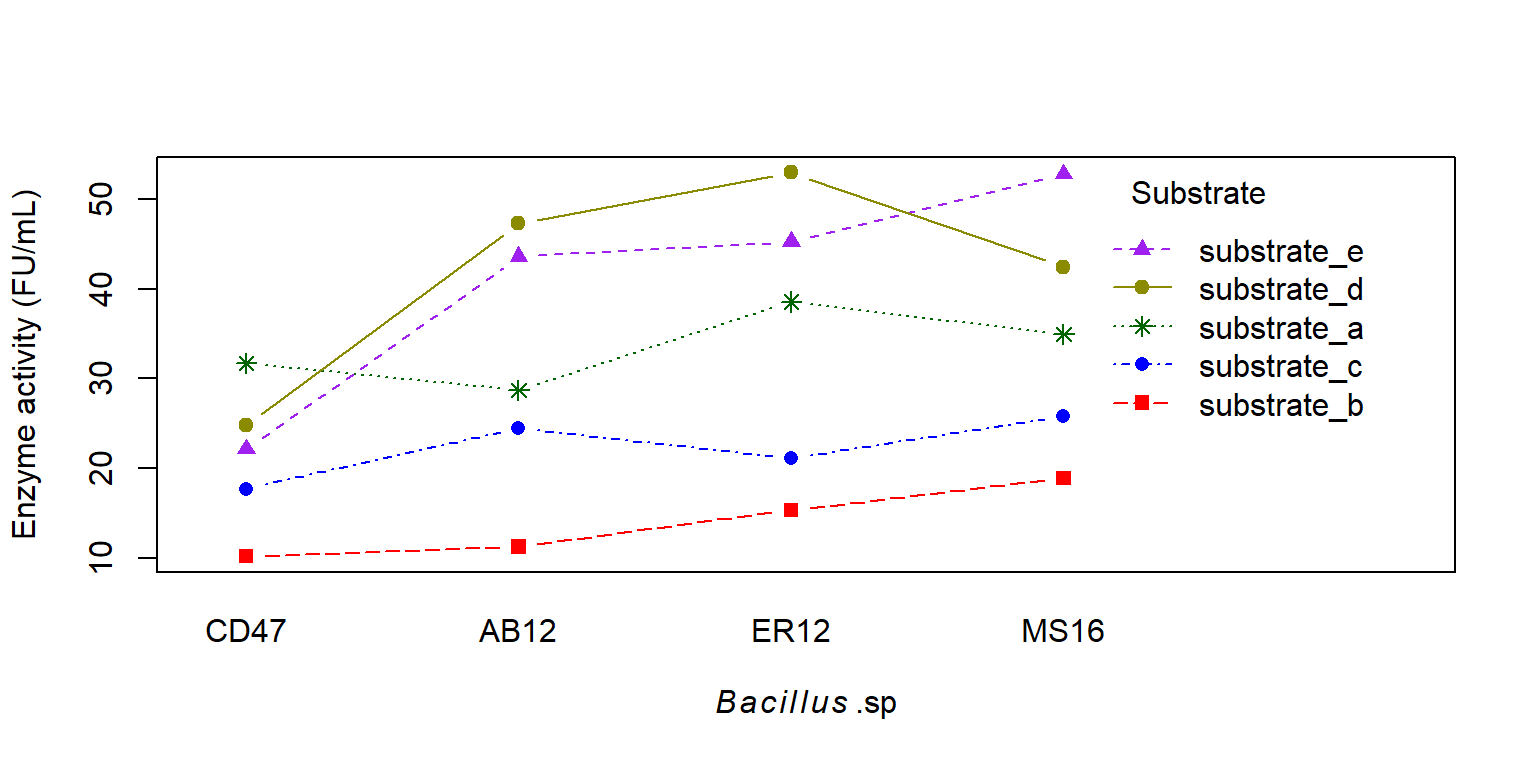
Two-way interaction plot
interaction.plot (x.factor = enzyme_df$ bacillus, trace.factor = enzyme_df$ substrate, trace.label = "Substrate" ,response = enzyme_df$ enzyme, fun = mean, type = "b" , legend = TRUE , xlab = expression (italic (Bacillus) ~ ".sp" ), ylab = "Enzyme activity (FU/mL)" ,pch = c (15 , 16 , 8 , 17 , 19 ), col = c ("red" , "blue" , "darkgreen" , "purple" , "yellow4" ))
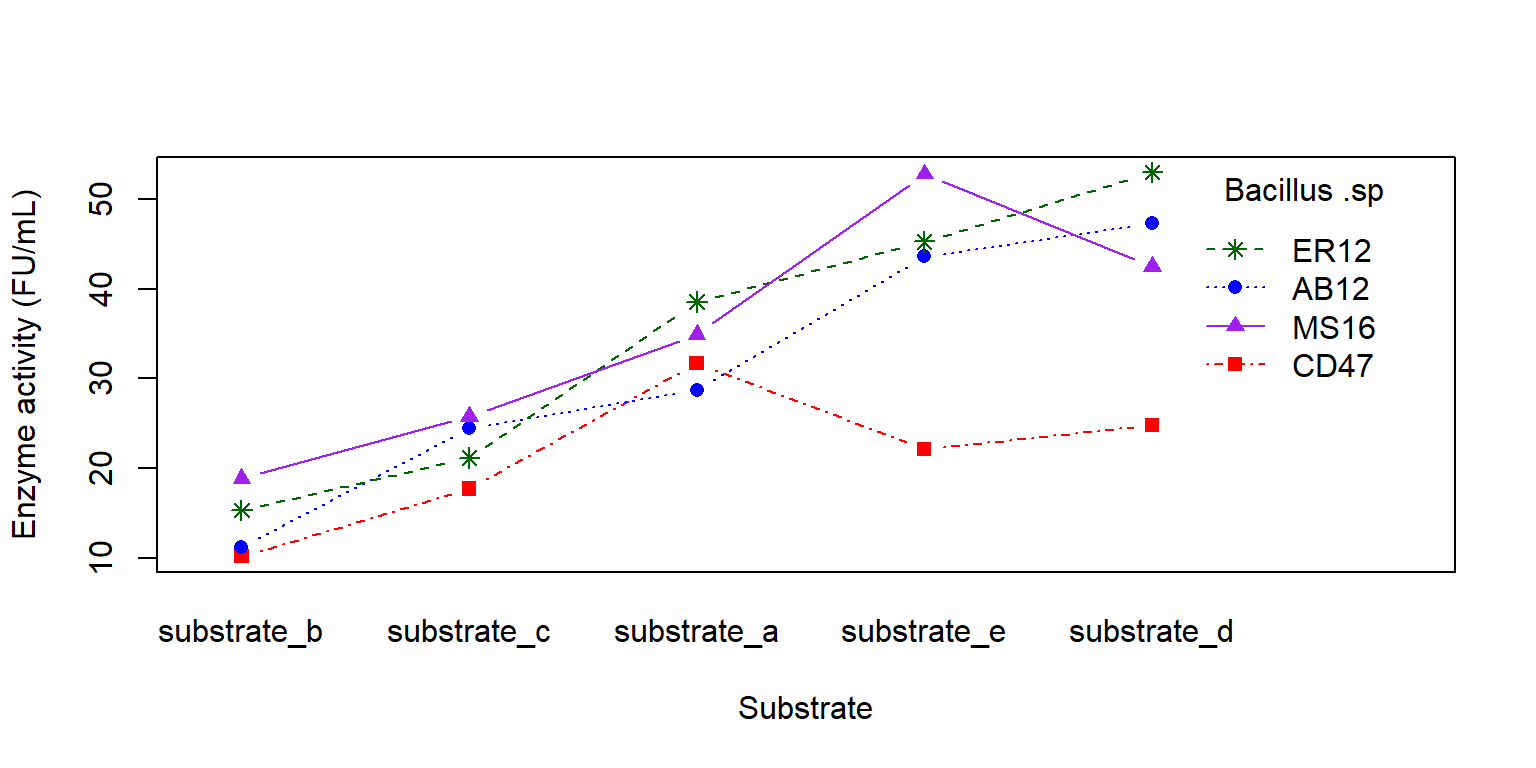
interaction.plot (x.factor = enzyme_df$ substrate, trace.factor = enzyme_df$ bacillus, trace.label = "Bacillus .sp" ,response = enzyme_df$ enzyme, fun = mean, type = "b" , legend = TRUE , xlab = "Substrate" , ylab = "Enzyme activity (FU/mL)" ,pch = c (15 , 16 , 8 , 17 , 19 ), col = c ("red" , "blue" , "darkgreen" , "purple" , "yellow4" ))
Bước 5: Phân tích ANOVA 2 yếu tố CRD
Tính p-value
# Compute two-way ANOVA test <- aov (enzyme ~ substrate + bacillus, data = enzyme_df)# summary(res.aov2) anova (res.aov2)
Analysis of Variance Table

Response: enzyme
          Df Sum Sq Mean Sq F value    Pr(>F)
substrate  4 7083.7 1770.92  58.712 < 2.2e-16 ***
bacillus   3 1833.5  611.17  20.263 7.869e-09 ***
Residuals 52 1568.5   30.16
---
Signif. codes:  0 '***' 0.001 '**' 0.01 '*' 0.05 '.' 0.1 ' ' 1
# Compute two-way ANOVA test with interaction effect <- aov (enzyme ~ substrate * bacillus, data = enzyme_df)anova (res.aov3)
Analysis of Variance Table

Response: enzyme
                   Df Sum Sq Mean Sq F value    Pr(>F)
substrate           4 7083.7 1770.92 816.050 < 2.2e-16 ***
bacillus            3 1833.5  611.17 281.632 < 2.2e-16 ***
substrate:bacillus 12 1481.7  123.47  56.896 < 2.2e-16 ***
Residuals          40   86.8    2.17
---
Signif. codes:  0 '***' 0.001 '**' 0.01 '*' 0.05 '.' 0.1 ' ' 1
Phân hạng
library (agricolae)LSD.test (res.aov2, c ("substrate" , "bacillus" ), console = TRUE )
Study: res.aov2 ~ c("substrate", "bacillus")

LSD t Test for enzyme

Mean Square Error:  30.16264

substrate:bacillus,  means and individual ( 95 %) CI

                   enzyme       std r       se       LCL      UCL     Min     Max      Q25     Q50      Q75
substrate_a:AB12 28.70833 3.2384490 3 3.170838 22.345581 35.07109 26.4125 32.4125 26.85625 27.3000 29.85625
substrate_a:CD47 31.67083 1.2577468 3 3.170838 25.308081 38.03359 30.2250 32.5125 31.25000 32.2750 32.39375
substrate_a:ER12 38.54167 2.1126972 3 3.170838 32.178914 44.90442 36.1750 40.2375 37.69375 39.2125 39.72500
substrate_a:MS16 34.91667 1.3123413 3 3.170838 28.553914 41.27942 33.5375 36.1500 34.30000 35.0625 35.60625
substrate_b:AB12 11.22083 2.0056301 3 3.170838  4.858081 17.58359  8.9500 12.7500 10.45625 11.9625 12.35625
substrate_b:CD47 10.14583 0.2905634 3 3.170838  3.783081 16.50859  9.9250 10.4750  9.98125 10.0375 10.25625
substrate_b:ER12 15.32083 0.6805711 3 3.170838  8.958081 21.68359 14.7250 16.0625 14.95000 15.1750 15.61875
substrate_b:MS16 18.87917 2.4626058 3 3.170838 12.516414 25.24192 16.5250 21.4375 17.60000 18.6750 20.05625
substrate_c:AB12 24.44583 1.3394456 3 3.170838 18.083081 30.80859 23.2000 25.8625 23.73750 24.2750 25.06875
substrate_c:CD47 17.70000 2.1391806 3 3.170838 11.337248 24.06275 15.4625 19.7250 16.68750 17.9125 18.81875
substrate_c:ER12 21.14167 0.8331354 3 3.170838 14.778914 27.50442 20.1875 21.7250 20.85000 21.5125 21.61875
substrate_c:MS16 25.78333 0.7496180 3 3.170838 19.420581 32.14609 25.1875 26.6250 25.36250 25.5375 26.08125
substrate_d:AB12 47.27500 1.1937991 3 3.170838 40.912248 53.63775 45.9125 48.1375 46.84375 47.7750 47.95625
substrate_d:CD47 24.79167 0.7073645 3 3.170838 18.428914 31.15442 24.0625 25.4750 24.45000 24.8375 25.15625
substrate_d:ER12 52.95417 0.3312697 3 3.170838 46.591414 59.31692 52.5750 53.1875 52.83750 53.1000 53.14375
substrate_d:MS16 42.43750 1.7193294 3 3.170838 36.074748 48.80025 40.4625 43.6000 41.85625 43.2500 43.42500
substrate_e:AB12 43.57083 1.1142776 3 3.170838 37.208081 49.93359 42.3875 44.6000 43.05625 43.7250 44.16250
substrate_e:CD47 22.12083 0.5511824 3 3.170838 15.758081 28.48359 21.5500 22.6500 21.85625 22.1625 22.40625
substrate_e:ER12 45.24167 0.4924958 3 3.170838 38.878914 51.60442 44.7000 45.6625 45.03125 45.3625 45.51250
substrate_e:MS16 52.78750 0.3269174 3 3.170838 46.424748 59.15025 52.4125 53.0125 52.67500 52.9375 52.97500

Alpha: 0.05 ; DF Error: 52
Critical Value of t: 2.006647

least Significant Difference: 8.998291

Treatments with the same letter are not significantly different.

                   enzyme groups
substrate_d:ER12 52.95417      a
substrate_e:MS16 52.78750      a
substrate_d:AB12 47.27500     ab
substrate_e:ER12 45.24167     ab
substrate_e:AB12 43.57083     bc
substrate_d:MS16 42.43750     bc
substrate_a:ER12 38.54167    bcd
substrate_a:MS16 34.91667    cde
substrate_a:CD47 31.67083    def
substrate_a:AB12 28.70833    efg
substrate_c:MS16 25.78333    fgh
substrate_d:CD47 24.79167    fgh
substrate_c:AB12 24.44583    fgh
substrate_e:CD47 22.12083    ghi
substrate_c:ER12 21.14167    ghi
substrate_b:MS16 18.87917    hij
substrate_c:CD47 17.70000    hij
substrate_b:ER12 15.32083     ij
substrate_b:AB12 11.22083      j
substrate_b:CD47 10.14583      j
duncan.test (res.aov2, c ("substrate" , "bacillus" ), console = TRUE )
Study: res.aov2 ~ c("substrate", "bacillus")

Duncan's new multiple range test
for enzyme

Mean Square Error:  30.16264

substrate:bacillus,  means

                   enzyme       std r       se     Min     Max      Q25     Q50      Q75
substrate_a:AB12 28.70833 3.2384490 3 3.170838 26.4125 32.4125 26.85625 27.3000 29.85625
substrate_a:CD47 31.67083 1.2577468 3 3.170838 30.2250 32.5125 31.25000 32.2750 32.39375
substrate_a:ER12 38.54167 2.1126972 3 3.170838 36.1750 40.2375 37.69375 39.2125 39.72500
substrate_a:MS16 34.91667 1.3123413 3 3.170838 33.5375 36.1500 34.30000 35.0625 35.60625
substrate_b:AB12 11.22083 2.0056301 3 3.170838  8.9500 12.7500 10.45625 11.9625 12.35625
substrate_b:CD47 10.14583 0.2905634 3 3.170838  9.9250 10.4750  9.98125 10.0375 10.25625
substrate_b:ER12 15.32083 0.6805711 3 3.170838 14.7250 16.0625 14.95000 15.1750 15.61875
substrate_b:MS16 18.87917 2.4626058 3 3.170838 16.5250 21.4375 17.60000 18.6750 20.05625
substrate_c:AB12 24.44583 1.3394456 3 3.170838 23.2000 25.8625 23.73750 24.2750 25.06875
substrate_c:CD47 17.70000 2.1391806 3 3.170838 15.4625 19.7250 16.68750 17.9125 18.81875
substrate_c:ER12 21.14167 0.8331354 3 3.170838 20.1875 21.7250 20.85000 21.5125 21.61875
substrate_c:MS16 25.78333 0.7496180 3 3.170838 25.1875 26.6250 25.36250 25.5375 26.08125
substrate_d:AB12 47.27500 1.1937991 3 3.170838 45.9125 48.1375 46.84375 47.7750 47.95625
substrate_d:CD47 24.79167 0.7073645 3 3.170838 24.0625 25.4750 24.45000 24.8375 25.15625
substrate_d:ER12 52.95417 0.3312697 3 3.170838 52.5750 53.1875 52.83750 53.1000 53.14375
substrate_d:MS16 42.43750 1.7193294 3 3.170838 40.4625 43.6000 41.85625 43.2500 43.42500
substrate_e:AB12 43.57083 1.1142776 3 3.170838 42.3875 44.6000 43.05625 43.7250 44.16250
substrate_e:CD47 22.12083 0.5511824 3 3.170838 21.5500 22.6500 21.85625 22.1625 22.40625
substrate_e:ER12 45.24167 0.4924958 3 3.170838 44.7000 45.6625 45.03125 45.3625 45.51250
substrate_e:MS16 52.78750 0.3269174 3 3.170838 52.4125 53.0125 52.67500 52.9375 52.97500

Alpha: 0.05 ; DF Error: 52

Critical Range
        2         3         4         5         6         7         8         9        10        11        12        13        14        15        16        17        18        19        20
 8.998291  9.464564  9.771386  9.993980 10.164993 10.301439 10.413258 10.506735 10.586085 10.654261 10.713409 10.765131 10.810657 10.850946 10.886760 10.918716 10.947317 10.972979 10.996050

Means with the same letter are not significantly different.

                   enzyme groups
substrate_d:ER12 52.95417      a
substrate_e:MS16 52.78750      a
substrate_d:AB12 47.27500     ab
substrate_e:ER12 45.24167     ab
substrate_e:AB12 43.57083    abc
substrate_d:MS16 42.43750     bc
substrate_a:ER12 38.54167    bcd
substrate_a:MS16 34.91667    cde
substrate_a:CD47 31.67083    def
substrate_a:AB12 28.70833    efg
substrate_c:MS16 25.78333   efgh
substrate_d:CD47 24.79167   fghi
substrate_c:AB12 24.44583   fghi
substrate_e:CD47 22.12083   fghi
substrate_c:ER12 21.14167   ghij
substrate_b:MS16 18.87917  ghijk
substrate_c:CD47 17.70000   hijk
substrate_b:ER12 15.32083    ijk
substrate_b:AB12 11.22083     jk
substrate_b:CD47 10.14583      k
HSD.test (res.aov2, c ("substrate" , "bacillus" ), console = TRUE )
Study: res.aov2 ~ c("substrate", "bacillus")

HSD Test for enzyme

Mean Square Error:  30.16264

substrate:bacillus,  means

                   enzyme       std r       se     Min     Max      Q25     Q50      Q75
substrate_a:AB12 28.70833 3.2384490 3 3.170838 26.4125 32.4125 26.85625 27.3000 29.85625
substrate_a:CD47 31.67083 1.2577468 3 3.170838 30.2250 32.5125 31.25000 32.2750 32.39375
substrate_a:ER12 38.54167 2.1126972 3 3.170838 36.1750 40.2375 37.69375 39.2125 39.72500
substrate_a:MS16 34.91667 1.3123413 3 3.170838 33.5375 36.1500 34.30000 35.0625 35.60625
substrate_b:AB12 11.22083 2.0056301 3 3.170838  8.9500 12.7500 10.45625 11.9625 12.35625
substrate_b:CD47 10.14583 0.2905634 3 3.170838  9.9250 10.4750  9.98125 10.0375 10.25625
substrate_b:ER12 15.32083 0.6805711 3 3.170838 14.7250 16.0625 14.95000 15.1750 15.61875
substrate_b:MS16 18.87917 2.4626058 3 3.170838 16.5250 21.4375 17.60000 18.6750 20.05625
substrate_c:AB12 24.44583 1.3394456 3 3.170838 23.2000 25.8625 23.73750 24.2750 25.06875
substrate_c:CD47 17.70000 2.1391806 3 3.170838 15.4625 19.7250 16.68750 17.9125 18.81875
substrate_c:ER12 21.14167 0.8331354 3 3.170838 20.1875 21.7250 20.85000 21.5125 21.61875
substrate_c:MS16 25.78333 0.7496180 3 3.170838 25.1875 26.6250 25.36250 25.5375 26.08125
substrate_d:AB12 47.27500 1.1937991 3 3.170838 45.9125 48.1375 46.84375 47.7750 47.95625
substrate_d:CD47 24.79167 0.7073645 3 3.170838 24.0625 25.4750 24.45000 24.8375 25.15625
substrate_d:ER12 52.95417 0.3312697 3 3.170838 52.5750 53.1875 52.83750 53.1000 53.14375
substrate_d:MS16 42.43750 1.7193294 3 3.170838 40.4625 43.6000 41.85625 43.2500 43.42500
substrate_e:AB12 43.57083 1.1142776 3 3.170838 42.3875 44.6000 43.05625 43.7250 44.16250
substrate_e:CD47 22.12083 0.5511824 3 3.170838 21.5500 22.6500 21.85625 22.1625 22.40625
substrate_e:ER12 45.24167 0.4924958 3 3.170838 44.7000 45.6625 45.03125 45.3625 45.51250
substrate_e:MS16 52.78750 0.3269174 3 3.170838 52.4125 53.0125 52.67500 52.9375 52.97500

Alpha: 0.05 ; DF Error: 52
Critical Value of Studentized Range: 5.276872

Minimun Significant Difference: 16.73211

Treatments with the same letter are not significantly different.

                   enzyme groups
substrate_d:ER12 52.95417      a
substrate_e:MS16 52.78750      a
substrate_d:AB12 47.27500     ab
substrate_e:ER12 45.24167    abc
substrate_e:AB12 43.57083    abc
substrate_d:MS16 42.43750   abcd
substrate_a:ER12 38.54167  abcde
substrate_a:MS16 34.91667  bcdef
substrate_a:CD47 31.67083 bcdefg
substrate_a:AB12 28.70833  cdefg
substrate_c:MS16 25.78333  defgh
substrate_d:CD47 24.79167   efgh
substrate_c:AB12 24.44583   efgh
substrate_e:CD47 22.12083   efgh
substrate_c:ER12 21.14167    fgh
substrate_b:MS16 18.87917    fgh
substrate_c:CD47 17.70000     gh
substrate_b:ER12 15.32083     gh
substrate_b:AB12 11.22083      h
substrate_b:CD47 10.14583      h
Tài liệu tham khảo
https://statsandr.com/blog/two-way-anova-in-r/
Analysis of a Two-Factor Completely Randomized Design in R
Outliers detection in R
https://www.r-bloggers.com/2016/12/outlier-detection-and-treatment-with-r/
https://stats.stackexchange.com/questions/61055/r-how-to-interpret-the-qqplots-outlier-numbers
http://www.sthda.com/english/wiki/two-way-anova-test-in-r
https://stackoverflow.com/questions/43123462/how-to-obtain-rmse-out-of-lm-result
https://online.stat.psu.edu/stat501/lesson/2/2.6
https://rcompanion.org/handbook/G_14.html
RMSE (Root Mean Square Error) https://agronomy4future.org/?p=15930
https://stats.stackexchange.com/questions/445200/coefficient-of-variation-for-beween-groups